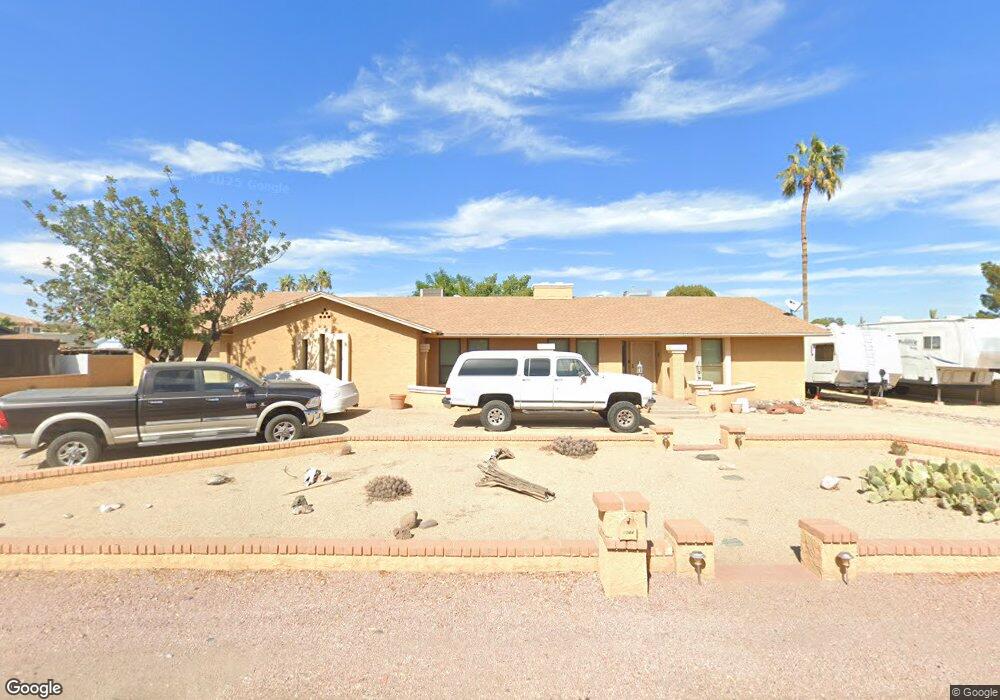
6744 W Grovers Ave Glendale, AZ 85308
Arrowhead NeighborhoodEstimated Value: $659,144 - $773,000
Studio
3
Baths
2,767
Sq Ft
$259/Sq Ft
Est. Value
About This Home
This home is located at 6744 W Grovers Ave, Glendale, AZ 85308 and is currently estimated at $717,036, approximately $259 per square foot. 6744 W Grovers Ave is a home located in Maricopa County with nearby schools including Highland Lakes School, Greenbrier Elementary School, and Deer Valley High School.
Ownership History
Date
Name
Owned For
Owner Type
Purchase Details
Closed on
Apr 9, 2015
Sold by
Brand Diane K
Bought by
Brand Dean M
Current Estimated Value
Home Financials for this Owner
Home Financials are based on the most recent Mortgage that was taken out on this home.
Original Mortgage
$150,000
Outstanding Balance
$115,305
Interest Rate
3.7%
Mortgage Type
New Conventional
Estimated Equity
$601,731
Purchase Details
Closed on
Dec 21, 2000
Sold by
Brand David L
Bought by
Brand Irene K
Home Financials for this Owner
Home Financials are based on the most recent Mortgage that was taken out on this home.
Original Mortgage
$100,050
Interest Rate
7.71%
Purchase Details
Closed on
May 21, 1996
Sold by
Howard Michael D and Howard Robin K
Bought by
Brand David L and Brand Irene K
Home Financials for this Owner
Home Financials are based on the most recent Mortgage that was taken out on this home.
Original Mortgage
$112,400
Interest Rate
7.96%
Mortgage Type
New Conventional
Create a Home Valuation Report for This Property
The Home Valuation Report is an in-depth analysis detailing your home's value as well as a comparison with similar homes in the area
Home Values in the Area
Average Home Value in this Area
Purchase History
| Date | Buyer | Sale Price | Title Company |
|---|---|---|---|
| Brand Dean M | -- | Pioneer Title Agency | |
| Brand Irene K | -- | First American Title | |
| Brand David L | $152,000 | Security Title Agency |
Source: Public Records
Mortgage History
| Date | Status | Borrower | Loan Amount |
|---|---|---|---|
| Open | Brand Dean M | $150,000 | |
| Closed | Brand Irene K | $100,050 | |
| Closed | Brand David L | $112,400 |
Source: Public Records
Tax History
| Year | Tax Paid | Tax Assessment Tax Assessment Total Assessment is a certain percentage of the fair market value that is determined by local assessors to be the total taxable value of land and additions on the property. | Land | Improvement |
|---|---|---|---|---|
| 2025 | $3,118 | $33,620 | -- | -- |
| 2024 | $3,186 | $32,019 | -- | -- |
| 2023 | $3,186 | $48,010 | $9,600 | $38,410 |
| 2022 | $3,108 | $38,720 | $7,740 | $30,980 |
| 2021 | $3,214 | $35,670 | $7,130 | $28,540 |
| 2020 | $3,179 | $32,050 | $6,410 | $25,640 |
| 2019 | $3,103 | $30,680 | $6,130 | $24,550 |
| 2018 | $3,032 | $29,450 | $5,890 | $23,560 |
| 2017 | $2,953 | $27,500 | $5,500 | $22,000 |
| 2016 | $2,815 | $27,460 | $5,490 | $21,970 |
| 2015 | $2,215 | $25,650 | $5,130 | $20,520 |
Source: Public Records
Map
Nearby Homes
- 6788 W Greenbriar Dr
- 6740 W Angela Dr
- 17244 N 66th Ln
- 17458 N 64th Dr
- 17445 N 64th Dr
- 6607 W Camino De La Campana
- 18242 N 66th Ave
- 6389 W Muriel Dr
- 7027 W Wagoner Rd
- 18161 N 63rd Ln
- 18585 N 70th Ave
- 7025 W Mcrae Way
- 18666 N 70th Dr
- 7143 W Union Hills Dr
- 18825 N 67th Dr
- 7102 W Julie Dr
- 6608 W Phelps Rd
- 7056 W Morrow Dr
- 7009 W Kimberly Way
- 7207 W Mcrae Way
- 6802 W Grovers Ave
- 6734 W Grovers Ave
- 6743 W Schmidt St
- 6801 W Schmidt St
- 6733 W Schmidt St
- 6741 W Grovers Ave
- 6731 W Grovers Ave
- 6812 W Grovers Ave
- 6724 W Grovers Ave
- 6803 W Grovers Ave
- 6723 W Schmidt St
- 6811 W Schmidt St
- 17729 N 67th Ln
- 6813 W Grovers Ave
- 6742 W Schmidt St
- 6716 W Angela Dr
- 6780 W Greenbriar Dr
- 6752 W Schmidt St
- 6724 W Angela Dr
- 6822 W Grovers Ave
Your Personal Tour Guide
Ask me questions while you tour the home.