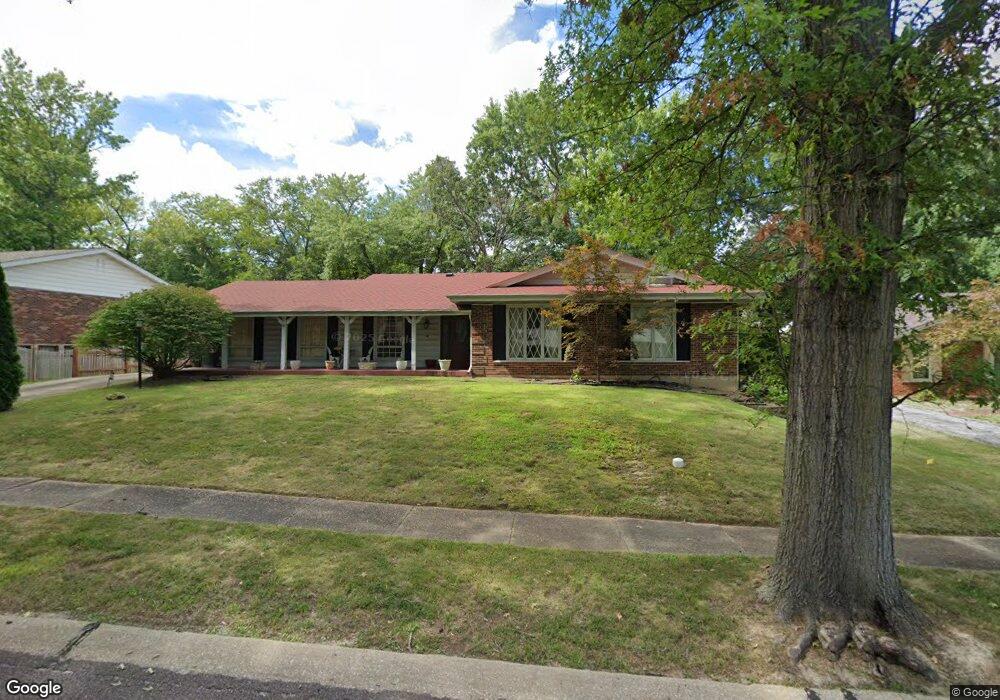
6745 Ryan Crest Dr Florissant, MO 63033
Estimated Value: $241,000 - $277,000
4
Beds
2
Baths
2,196
Sq Ft
$117/Sq Ft
Est. Value
About This Home
This home is located at 6745 Ryan Crest Dr, Florissant, MO 63033 and is currently estimated at $257,223, approximately $117 per square foot. 6745 Ryan Crest Dr is a home located in St. Louis County with nearby schools including Townsend Elementary School, Central Middle School, and Hazelwood Central High School.
Ownership History
Date
Name
Owned For
Owner Type
Purchase Details
Closed on
Aug 8, 2016
Sold by
Porter Walker Barbara and Walker Barbara
Bought by
Porter Walker Barbara
Current Estimated Value
Home Financials for this Owner
Home Financials are based on the most recent Mortgage that was taken out on this home.
Original Mortgage
$154,304
Outstanding Balance
$124,178
Interest Rate
3.75%
Mortgage Type
FHA
Estimated Equity
$133,045
Purchase Details
Closed on
Jan 13, 2016
Sold by
Walker Antoine Christian and Winfield Karbin C
Bought by
Walker Barbara
Purchase Details
Closed on
Jul 18, 2008
Sold by
Mack Marvin L and Mack Belinda
Bought by
Walker Ellis
Home Financials for this Owner
Home Financials are based on the most recent Mortgage that was taken out on this home.
Original Mortgage
$181,157
Interest Rate
6.4%
Mortgage Type
FHA
Purchase Details
Closed on
Jun 28, 2005
Sold by
Porter Barbara
Bought by
Mack Marvin L
Create a Home Valuation Report for This Property
The Home Valuation Report is an in-depth analysis detailing your home's value as well as a comparison with similar homes in the area
Home Values in the Area
Average Home Value in this Area
Purchase History
| Date | Buyer | Sale Price | Title Company |
|---|---|---|---|
| Porter Walker Barbara | -- | Title Partners Agency Llc | |
| Walker Barbara | -- | None Available | |
| Walker Ellis | $184,000 | Title Partners Agency Llc | |
| Mack Marvin L | $175,000 | Residential Title Svcs Inc |
Source: Public Records
Mortgage History
| Date | Status | Borrower | Loan Amount |
|---|---|---|---|
| Open | Porter Walker Barbara | $154,304 | |
| Closed | Walker Ellis | $181,157 |
Source: Public Records
Tax History Compared to Growth
Tax History
| Year | Tax Paid | Tax Assessment Tax Assessment Total Assessment is a certain percentage of the fair market value that is determined by local assessors to be the total taxable value of land and additions on the property. | Land | Improvement |
|---|---|---|---|---|
| 2025 | $3,874 | $43,800 | $3,440 | $40,360 |
| 2024 | $3,874 | $42,640 | $3,440 | $39,200 |
| 2023 | $3,860 | $42,640 | $3,440 | $39,200 |
| 2022 | $3,229 | $31,690 | $7,620 | $24,070 |
| 2021 | $3,056 | $31,690 | $7,620 | $24,070 |
| 2020 | $2,706 | $26,110 | $5,720 | $20,390 |
| 2019 | $2,663 | $26,110 | $5,720 | $20,390 |
| 2018 | $2,532 | $22,950 | $3,840 | $19,110 |
| 2017 | $2,529 | $22,950 | $3,840 | $19,110 |
| 2016 | $3,085 | $27,590 | $3,060 | $24,530 |
| 2015 | $3,014 | $27,590 | $3,060 | $24,530 |
| 2014 | $2,660 | $24,210 | $4,750 | $19,460 |
Source: Public Records
Map
Nearby Homes
- 12713 Partridge Run Dr
- 6665 Lakeside Hills Dr
- 12432 Quatre Dr
- 6646 Foothills Ct
- 6787 Lesli Mari Ct
- 12225 Tarpon Dr
- 6587 Dolphin Cir E Unit 110B
- 6470 White Cap Ln Unit D
- 6595 Dolphin Cir E Unit 131A
- 12435 Sea Lane Dr Unit 5
- 6803 Foxbend Ct
- 6862 Foxbend Ct
- 12456 Sea Lane Dr Unit A
- 12750 Needle Point Ct
- 12320 Missile Ln
- 6250 Pennyrich Ct
- 12705 Stubwood Dr
- 17 Nob Hill Dr
- 12136 La Padera Ln
- 12111 La Padera Ln
- 6753 Ryan Crest Dr
- 6735 Ryan Crest Dr
- 6742 Blossom View Dr
- 6752 Blossom View Dr
- 6732 Blossom View Dr
- 6755 Ryan Crest Dr
- 6740 Ryan Crest Dr
- 6725 Ryan Crest Dr
- 6730 Ryan Crest Dr
- 6744 Ryan Crest Dr
- 6762 Blossom View Dr
- 6720 Ryan Crest Dr
- 6722 Blossom View Dr
- 6750 Ryan Crest Dr
- 6715 Ryan Crest Dr
- 6765 Ryan Crest Dr
- 6772 Blossom View Dr
- 6710 Ryan Crest Dr
- 6741 Blossom View Dr
- 6751 Blossom View Dr