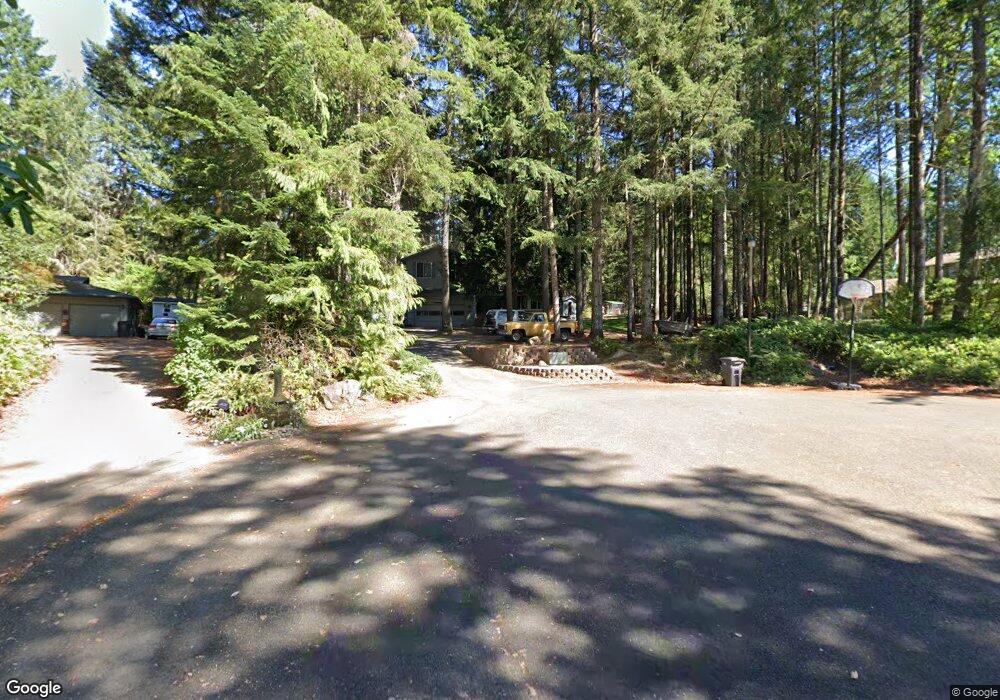
6745 SE Regency Ct Port Orchard, WA 98367
Bethel NeighborhoodEstimated Value: $565,631 - $655,000
4
Beds
3
Baths
2,059
Sq Ft
$293/Sq Ft
Est. Value
About This Home
This home is located at 6745 SE Regency Ct, Port Orchard, WA 98367 and is currently estimated at $604,158, approximately $293 per square foot. 6745 SE Regency Ct is a home located in Kitsap County with nearby schools including Mullenix Ridge Elementary School, Marcus Whitman Middle School, and South Kitsap High School.
Ownership History
Date
Name
Owned For
Owner Type
Purchase Details
Closed on
Jul 29, 2013
Sold by
Nelsen Catherine
Bought by
Nelsen James
Current Estimated Value
Home Financials for this Owner
Home Financials are based on the most recent Mortgage that was taken out on this home.
Original Mortgage
$242,500
Outstanding Balance
$176,902
Interest Rate
3.92%
Mortgage Type
New Conventional
Estimated Equity
$427,256
Purchase Details
Closed on
Feb 22, 2008
Sold by
Watson Gary L and Watson Yoshiko F
Bought by
Air Castle Properties Llc
Home Financials for this Owner
Home Financials are based on the most recent Mortgage that was taken out on this home.
Original Mortgage
$75,000
Interest Rate
5.41%
Mortgage Type
Stand Alone Second
Create a Home Valuation Report for This Property
The Home Valuation Report is an in-depth analysis detailing your home's value as well as a comparison with similar homes in the area
Home Values in the Area
Average Home Value in this Area
Purchase History
| Date | Buyer | Sale Price | Title Company |
|---|---|---|---|
| Nelsen James | -- | Accommodation | |
| Nelsen James | $250,280 | Fidelity Ntl Kitsap County | |
| Air Castle Properties Llc | $239,291 | Transnation Title Ins Co |
Source: Public Records
Mortgage History
| Date | Status | Borrower | Loan Amount |
|---|---|---|---|
| Open | Nelsen James | $242,500 | |
| Previous Owner | Air Castle Properties Llc | $75,000 | |
| Previous Owner | Air Castle Properties Llc | $95,000 |
Source: Public Records
Tax History Compared to Growth
Tax History
| Year | Tax Paid | Tax Assessment Tax Assessment Total Assessment is a certain percentage of the fair market value that is determined by local assessors to be the total taxable value of land and additions on the property. | Land | Improvement |
|---|---|---|---|---|
| 2026 | $4,288 | $488,980 | $100,660 | $388,320 |
| 2025 | $4,288 | $488,980 | $100,660 | $388,320 |
| 2024 | $4,158 | $488,980 | $100,660 | $388,320 |
| 2023 | $4,131 | $488,980 | $100,660 | $388,320 |
| 2022 | $3,947 | $391,180 | $80,520 | $310,660 |
| 2021 | $3,660 | $342,730 | $71,900 | $270,830 |
| 2020 | $3,612 | $328,790 | $65,750 | $263,040 |
| 2019 | $3,061 | $305,370 | $61,010 | $244,360 |
| 2018 | $3,243 | $249,280 | $55,230 | $194,050 |
| 2017 | $2,755 | $249,280 | $55,230 | $194,050 |
| 2016 | $2,703 | $223,750 | $52,600 | $171,150 |
| 2015 | $2,616 | $219,400 | $52,600 | $166,800 |
| 2014 | -- | $206,500 | $56,270 | $150,230 |
| 2013 | -- | $223,430 | $74,160 | $149,270 |
Source: Public Records
Map
Nearby Homes
- 6830 Arlington Place SE
- 2670 SE Bielmeier Rd
- 0 SE Bethel Rd Unit NWM2437882
- 2569 SE Spring Creek Rd
- 6146 Windlass Ave SE
- 0 (Lot 1) SE Spring Creek Rd
- 7988 Bethel Burley Rd SE
- 3371 SE Bielmeier Rd Unit 85
- 3371 SE Bielmeier Rd Unit 47
- 3371 SE Bielmeier Rd Unit 26
- 3371 SE Bielmeier Rd Unit 91
- 3371 SE Bielmeier Rd Unit 79
- 3371 SE Bielmeier Rd Unit 80
- 3371 SE Bielmeier Rd Unit 95
- 3371 SE Bielmeier Rd Unit 33A
- 6498 Skipper Ln SE
- 5673 Bethel Rd SE Unit 28
- 1577 SE Oregon St
- 6685 Skipper Ln SE
- 6603 Skipper Ln SE
- 6775 SE Regency Ct
- 6720 N van Decar Rd SE
- 6725 SE Regency Ct
- 6797 SE Regency Ct
- 6795 Regency Dr SE
- 6715 SE Regency Ct
- 6805 Regency Dr SE
- 6730 N van Decar Rd SE
- 6718 N van Decar Rd SE
- 6650 N van Decar Rd SE
- 2209 SE Bielmeier Rd
- 6800 Regency Dr SE
- 6740 Regency Dr SE
- 6710 Regency Dr SE
- 6695 Regency Dr SE
- 6634 N van Decar Rd SE
- 6690 Regency Dr SE
- 2221 SE Bielmeier Rd
- 6706 N van Decar Rd SE
- 6628 N van Decar Rd SE