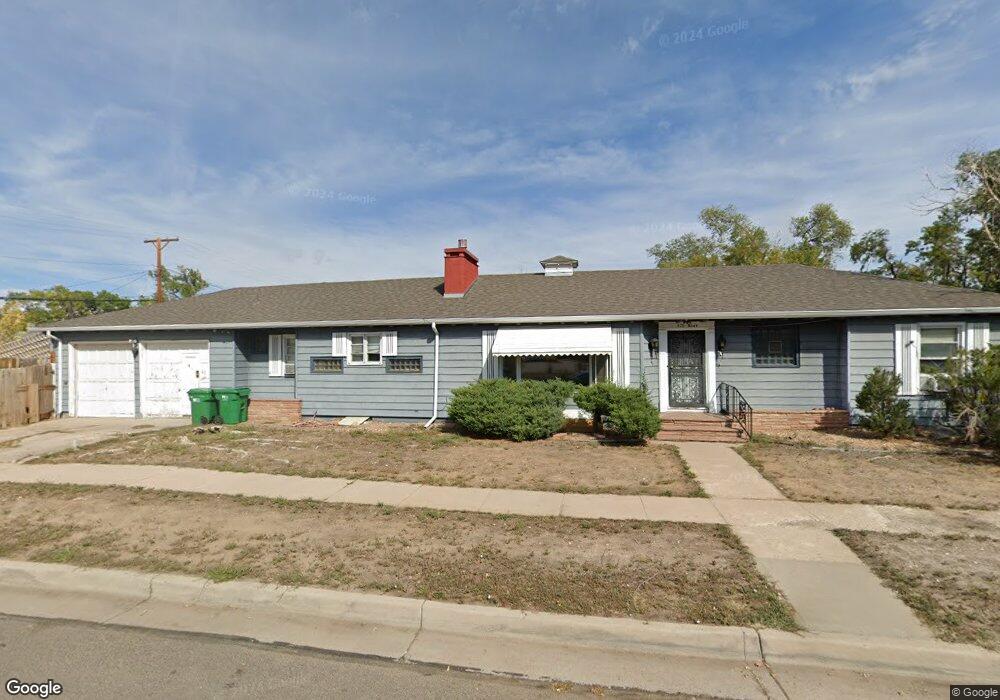
675 Bush St Brighton, CO 80601
Estimated Value: $416,368 - $449,000
4
Beds
2
Baths
1,506
Sq Ft
$289/Sq Ft
Est. Value
About This Home
This home is located at 675 Bush St, Brighton, CO 80601 and is currently estimated at $435,342, approximately $289 per square foot. 675 Bush St is a home located in Adams County with nearby schools including South Elementary School, Vikan Middle School, and Brighton High School.
Ownership History
Date
Name
Owned For
Owner Type
Purchase Details
Closed on
Aug 8, 1994
Sold by
Sebastian Cynthia C
Bought by
Pollack Daniel J and Pollack Esther
Current Estimated Value
Home Financials for this Owner
Home Financials are based on the most recent Mortgage that was taken out on this home.
Original Mortgage
$91,800
Interest Rate
8.51%
Purchase Details
Closed on
Jul 5, 1994
Sold by
Sebastian James Barry and Sebastian Cynthia C
Bought by
Sebastian Cynthia C
Home Financials for this Owner
Home Financials are based on the most recent Mortgage that was taken out on this home.
Original Mortgage
$91,800
Interest Rate
8.51%
Create a Home Valuation Report for This Property
The Home Valuation Report is an in-depth analysis detailing your home's value as well as a comparison with similar homes in the area
Home Values in the Area
Average Home Value in this Area
Purchase History
| Date | Buyer | Sale Price | Title Company |
|---|---|---|---|
| Pollack Daniel J | $102,000 | -- | |
| Sebastian Cynthia C | -- | -- |
Source: Public Records
Mortgage History
| Date | Status | Borrower | Loan Amount |
|---|---|---|---|
| Closed | Pollack Daniel J | $91,800 |
Source: Public Records
Tax History Compared to Growth
Tax History
| Year | Tax Paid | Tax Assessment Tax Assessment Total Assessment is a certain percentage of the fair market value that is determined by local assessors to be the total taxable value of land and additions on the property. | Land | Improvement |
|---|---|---|---|---|
| 2024 | $2,806 | $25,250 | $5,310 | $19,940 |
| 2023 | $2,793 | $29,090 | $5,410 | $23,680 |
| 2022 | $2,644 | $24,070 | $4,930 | $19,140 |
| 2021 | $2,479 | $24,070 | $4,930 | $19,140 |
| 2020 | $2,309 | $23,380 | $4,860 | $18,520 |
| 2019 | $2,311 | $23,380 | $4,860 | $18,520 |
| 2018 | $1,827 | $18,480 | $4,750 | $13,730 |
| 2017 | $1,825 | $18,480 | $4,750 | $13,730 |
| 2016 | $1,125 | $11,350 | $2,390 | $8,960 |
| 2015 | $1,122 | $11,350 | $2,390 | $8,960 |
| 2014 | -- | $13,120 | $1,910 | $11,210 |
Source: Public Records
Map
Nearby Homes