Estimated Value: $518,000 - $590,000
3
Beds
2
Baths
1,865
Sq Ft
$291/Sq Ft
Est. Value
About This Home
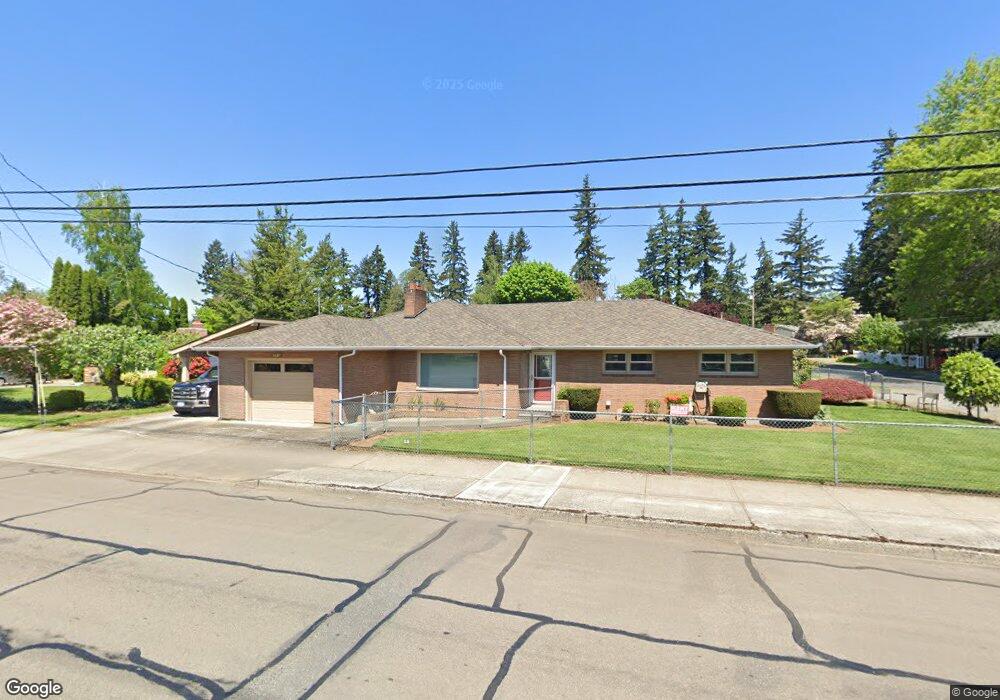
This home is located at 675 C St, Washougal, WA 98671 and is currently estimated at $543,543, approximately $291 per square foot. 675 C St is a home located in Clark County with nearby schools including Gause Elementary School, Jemtegaard Middle School, and Washougal High School.
Ownership History
Date
Name
Owned For
Owner Type
Purchase Details
Closed on
Mar 30, 2022
Sold by
Yule V David C and Yule Corinne V
Bought by
Gorman Holly C and Gorman Corey L
Current Estimated Value
Purchase Details
Closed on
Apr 11, 2013
Sold by
Yule David C
Bought by
Yule David C and Yule Corinne
Purchase Details
Closed on
Sep 8, 2009
Sold by
Sheaffer Patrick
Bought by
Yule David C
Home Financials for this Owner
Home Financials are based on the most recent Mortgage that was taken out on this home.
Original Mortgage
$50,100
Interest Rate
5.2%
Mortgage Type
New Conventional
Purchase Details
Closed on
Nov 15, 2004
Sold by
Ruiter Lena
Bought by
Sheaffer Patrick and Sheaffer Janice Y
Purchase Details
Closed on
Mar 15, 2002
Sold by
Ruiter Lena
Bought by
Ruiter Lena
Create a Home Valuation Report for This Property
The Home Valuation Report is an in-depth analysis detailing your home's value as well as a comparison with similar homes in the area
Home Values in the Area
Average Home Value in this Area
Purchase History
| Date | Buyer | Sale Price | Title Company |
|---|---|---|---|
| Gorman Holly C | $300,000 | Fidelity National Title | |
| Yule David C | -- | None Available | |
| Yule David C | $180,000 | Clark County Title | |
| Sheaffer Patrick | $100,000 | Clark County Title | |
| Ruiter Lena | -- | -- |
Source: Public Records
Mortgage History
| Date | Status | Borrower | Loan Amount |
|---|---|---|---|
| Previous Owner | Yule David C | $50,100 |
Source: Public Records
Tax History Compared to Growth
Tax History
| Year | Tax Paid | Tax Assessment Tax Assessment Total Assessment is a certain percentage of the fair market value that is determined by local assessors to be the total taxable value of land and additions on the property. | Land | Improvement |
|---|---|---|---|---|
| 2025 | $5,204 | $495,410 | $116,512 | $378,898 |
| 2024 | $4,856 | $548,582 | $160,787 | $387,795 |
| 2023 | $4,672 | $535,730 | $160,787 | $374,943 |
| 2022 | $4,774 | $504,769 | $153,796 | $350,973 |
| 2021 | $4,514 | $447,577 | $135,154 | $312,423 |
| 2020 | $4,018 | $397,110 | $122,338 | $274,772 |
| 2019 | $3,779 | $359,022 | $116,512 | $242,510 |
| 2018 | $4,178 | $357,019 | $0 | $0 |
| 2017 | $3,308 | $325,854 | $0 | $0 |
| 2016 | $3,087 | $283,314 | $0 | $0 |
| 2015 | $2,850 | $241,733 | $0 | $0 |
| 2014 | -- | $222,052 | $0 | $0 |
| 2013 | -- | $189,620 | $0 | $0 |
Source: Public Records
Map
Nearby Homes
- 794 S A St
- 878 I St
- 463 K St
- 766 K St
- 1306 B St
- 1068 9th St
- 2859 NE 2nd Ave
- 690 N Shepherd Rd
- 293 N Shepherd Rd
- 1854 H St
- 1913 E St
- 0 Leburn Rd Unit 22544235
- 0 Green View Estates II Unit NWM2384289
- 1345 N R St
- 654 W S St
- 2132 N 3rd St
- 0 SE Tampa St Unit NWM2442817
- 726 SE Tampa St
- 0 SE Tampa St Unit 650912142
- 0 SE Tampa St Unit 626113580