Estimated Value: $129,005 - $289,000
3
Beds
2
Baths
974
Sq Ft
$218/Sq Ft
Est. Value
About This Home
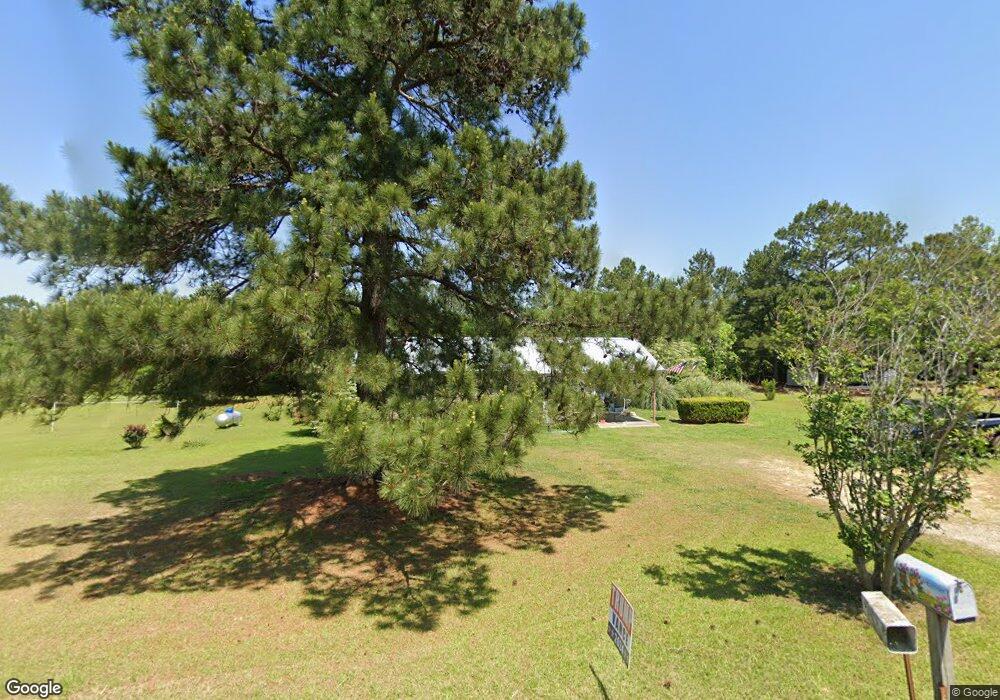
This home is located at 675 Chula Brookfield Rd, Chula, GA 31733 and is currently estimated at $212,002, approximately $217 per square foot. 675 Chula Brookfield Rd is a home located in Tift County with nearby schools including Len Lastinger Primary School, Matt Wilson Elementary School, and J.T. Reddick School.
Ownership History
Date
Name
Owned For
Owner Type
Purchase Details
Closed on
Mar 18, 2024
Sold by
Miller Rentals Llc
Bought by
Ntc Rental Llc
Current Estimated Value
Purchase Details
Closed on
Feb 22, 2013
Sold by
B & D Properties Llp
Bought by
Miller Rentals Llc
Home Financials for this Owner
Home Financials are based on the most recent Mortgage that was taken out on this home.
Original Mortgage
$80,250
Interest Rate
3.43%
Mortgage Type
New Conventional
Purchase Details
Closed on
Sep 12, 2002
Sold by
Day Don W
Bought by
Properties Llp B and Properties Properties,Llp D
Purchase Details
Closed on
Sep 9, 1994
Bought by
Day Don W
Purchase Details
Closed on
Mar 15, 1993
Bought by
Golden Douglas
Purchase Details
Closed on
Dec 2, 1991
Bought by
Cooper Tammy
Purchase Details
Closed on
Mar 1, 1990
Bought by
Day Don W
Create a Home Valuation Report for This Property
The Home Valuation Report is an in-depth analysis detailing your home's value as well as a comparison with similar homes in the area
Purchase History
| Date | Buyer | Sale Price | Title Company |
|---|---|---|---|
| Ntc Rental Llc | -- | -- | |
| Miller Rentals Llc | $95,000 | -- | |
| Properties Llp B | $200,000 | -- | |
| Day Don W | -- | -- | |
| Golden Douglas | $40,000 | -- | |
| Cooper Tammy | $30,000 | -- | |
| Day Don W | $38,300 | -- |
Source: Public Records
Mortgage History
| Date | Status | Borrower | Loan Amount |
|---|---|---|---|
| Previous Owner | Miller Rentals Llc | $80,250 |
Source: Public Records
Tax History
| Year | Tax Paid | Tax Assessment Tax Assessment Total Assessment is a certain percentage of the fair market value that is determined by local assessors to be the total taxable value of land and additions on the property. | Land | Improvement |
|---|---|---|---|---|
| 2025 | $680 | $31,148 | $2,373 | $28,775 |
| 2024 | $680 | $37,629 | $2,373 | $35,256 |
| 2023 | $758 | $22,200 | $3,000 | $19,200 |
| 2022 | $659 | $22,200 | $3,000 | $19,200 |
| 2021 | $663 | $22,200 | $3,000 | $19,200 |
| 2020 | $676 | $22,200 | $3,000 | $19,200 |
| 2019 | $674 | $22,200 | $3,000 | $19,200 |
| 2018 | $673 | $22,200 | $3,000 | $19,200 |
| 2017 | $676 | $22,200 | $3,000 | $19,200 |
| 2016 | $677 | $22,200 | $3,000 | $19,200 |
| 2015 | $677 | $22,200 | $3,000 | $19,200 |
| 2014 | $679 | $22,200 | $3,000 | $19,200 |
| 2013 | -- | $22,200 | $3,000 | $19,200 |
Source: Public Records
Map
Nearby Homes
- 18 Hank Mike Rd
- 746 Chula Brookfield Rd
- 50 Hank Mike Rd
- 257 Adams Rd
- 277 Wesley Rigdon Rd
- 87 Waterfront St
- n/a Wiley Branch Rd
- 100 Long Pine Rd
- 0 Brighton Rd
- 897 Wiley Branch Rd
- 136 S Access Rd
- 142 Brighton Rd
- 50 Margaret Ln
- 901 Wiley Branch Rd
- 68 Rose Ave
- 5704 Forest Lake Dr W
- 603 48th St
- 346 Somers Ln
- 909 E 46th St
- Lot 222 Forest Lakes Dr
- 667 Chula Brookfield Rd
- 685 Chula Brookfield Rd
- 674 Chula Brookfield Rd
- 680 Chula Brookfield Rd
- 668 Chula Brookfield Rd
- 5106 Ga Highway 125 N
- 698 Chula Brookfield Rd
- 693 Chula Brookfield Rd
- 688 Chula Brookfield Rd
- 5089 Georgia 125
- 5099 Georgia 125
- 696 Chula Brookfield Rd
- 5099 Ga Highway 125 N
- 701 Chula Brookfield Rd
- 5089 Ga Highway 125 N
- 5085 Ga Highway 125 N
- 4956 Ga Highway 125 N
- 4970 Ga Highway 125 N
- 4967 Ga Highway 125 N
- 4947 Ga Highway 125 N
Your Personal Tour Guide
Ask me questions while you tour the home.