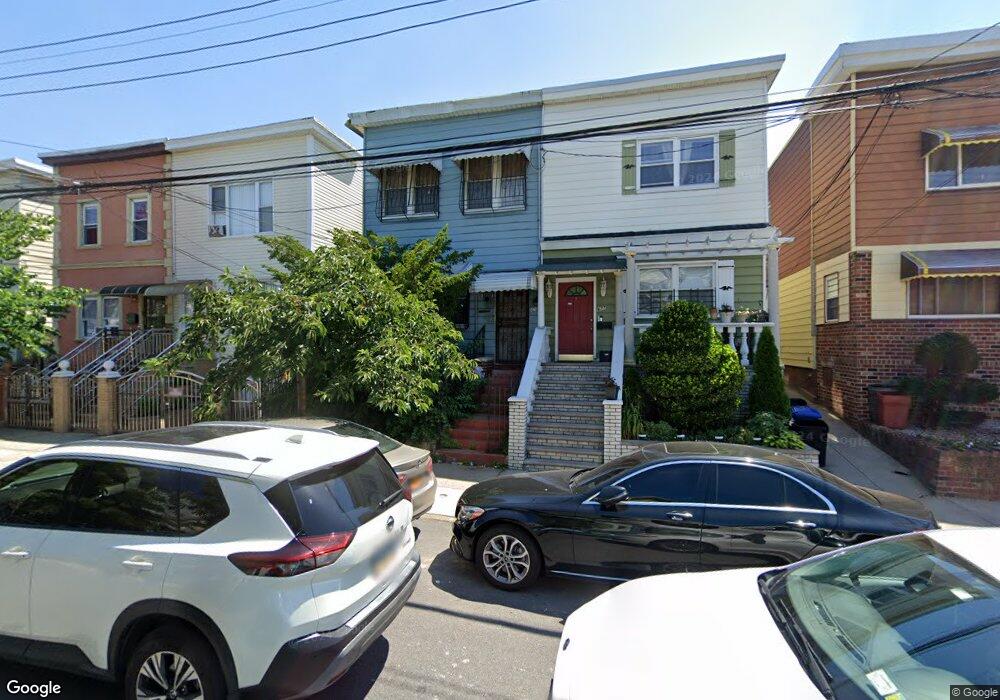
675 E 39th St Brooklyn, NY 11203
East Flatbush NeighborhoodEstimated Value: $699,000 - $885,000
--
Bed
--
Bath
2,040
Sq Ft
$380/Sq Ft
Est. Value
About This Home
This home is located at 675 E 39th St, Brooklyn, NY 11203 and is currently estimated at $776,079, approximately $380 per square foot. 675 E 39th St is a home located in Kings County with nearby schools including P.S. 198 Brooklyn, Andries Hudde School, and Central Brooklyn Ascend Charter.
Ownership History
Date
Name
Owned For
Owner Type
Purchase Details
Closed on
May 21, 2020
Sold by
Case Burgette
Bought by
The Burgette Case Living Trust
Current Estimated Value
Purchase Details
Closed on
Oct 30, 2003
Sold by
Case Burgette and Case Oswald
Bought by
Case Burgette
Home Financials for this Owner
Home Financials are based on the most recent Mortgage that was taken out on this home.
Original Mortgage
$228,750
Interest Rate
5.82%
Mortgage Type
Purchase Money Mortgage
Purchase Details
Closed on
Apr 3, 1997
Sold by
Adams Beryl
Bought by
Case Burgette and Case Oswald
Home Financials for this Owner
Home Financials are based on the most recent Mortgage that was taken out on this home.
Original Mortgage
$175,000
Interest Rate
7.85%
Create a Home Valuation Report for This Property
The Home Valuation Report is an in-depth analysis detailing your home's value as well as a comparison with similar homes in the area
Home Values in the Area
Average Home Value in this Area
Purchase History
| Date | Buyer | Sale Price | Title Company |
|---|---|---|---|
| The Burgette Case Living Trust | -- | -- | |
| The Burgette Case Living Trust | -- | -- | |
| Case Burgette | -- | -- | |
| Case Burgette | -- | -- | |
| Case Burgette | $185,500 | Chicago Title Insurance Co | |
| Case Burgette | $185,500 | Chicago Title Insurance Co |
Source: Public Records
Mortgage History
| Date | Status | Borrower | Loan Amount |
|---|---|---|---|
| Previous Owner | Case Burgette | $228,750 | |
| Previous Owner | Case Burgette | $175,000 |
Source: Public Records
Tax History Compared to Growth
Tax History
| Year | Tax Paid | Tax Assessment Tax Assessment Total Assessment is a certain percentage of the fair market value that is determined by local assessors to be the total taxable value of land and additions on the property. | Land | Improvement |
|---|---|---|---|---|
| 2025 | $6,527 | $43,080 | $14,940 | $28,140 |
| 2024 | $6,527 | $50,700 | $14,940 | $35,760 |
| 2023 | $6,210 | $44,820 | $14,940 | $29,880 |
| 2022 | $5,736 | $43,020 | $14,940 | $28,080 |
| 2021 | $5,694 | $35,820 | $14,940 | $20,880 |
| 2020 | $2,830 | $37,440 | $14,940 | $22,500 |
| 2019 | $5,616 | $37,440 | $14,940 | $22,500 |
| 2018 | $5,135 | $26,649 | $11,190 | $15,459 |
| 2017 | $4,826 | $25,143 | $12,496 | $12,647 |
| 2016 | $4,432 | $23,720 | $12,078 | $11,642 |
| 2015 | $2,641 | $23,720 | $13,950 | $9,770 |
| 2014 | $2,641 | $23,540 | $15,415 | $8,125 |
Source: Public Records
Map
Nearby Homes