Estimated Value: $432,000 - $482,000
2
Beds
2
Baths
1,542
Sq Ft
$298/Sq Ft
Est. Value
About This Home
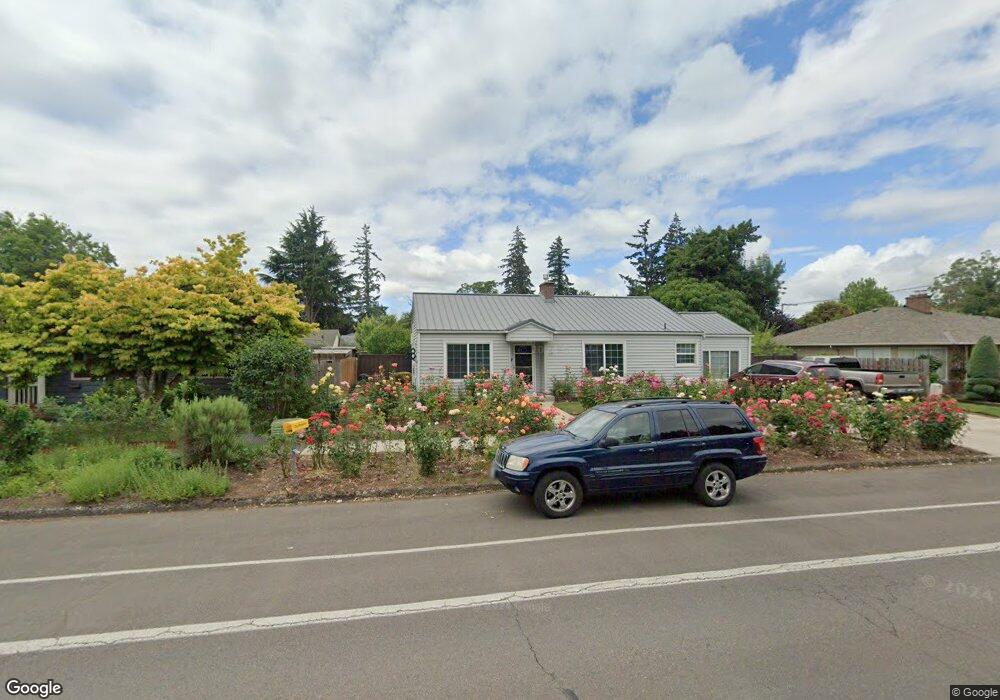
This home is located at 675 N Grant St, Canby, OR 97013 and is currently estimated at $460,165, approximately $298 per square foot. 675 N Grant St is a home located in Clackamas County with nearby schools including Josefa L. Sambrano Elementary School, William Knight Elementary School, and Baker Prairie Middle School.
Ownership History
Date
Name
Owned For
Owner Type
Purchase Details
Closed on
Jun 7, 2019
Sold by
Huiras Sheryl L and Huiras Gordon L
Bought by
Gordon L Huiras & Sheryl L Huiras Rev Tr
Current Estimated Value
Purchase Details
Closed on
Jul 1, 1992
Bought by
Huiras Sheryl L and Huiras Gordon L
Create a Home Valuation Report for This Property
The Home Valuation Report is an in-depth analysis detailing your home's value as well as a comparison with similar homes in the area
Home Values in the Area
Average Home Value in this Area
Purchase History
| Date | Buyer | Sale Price | Title Company |
|---|---|---|---|
| Gordon L Huiras & Sheryl L Huiras Rev Tr | -- | None Available | |
| Huiras Sheryl L | -- | -- |
Source: Public Records
Tax History Compared to Growth
Tax History
| Year | Tax Paid | Tax Assessment Tax Assessment Total Assessment is a certain percentage of the fair market value that is determined by local assessors to be the total taxable value of land and additions on the property. | Land | Improvement |
|---|---|---|---|---|
| 2025 | $3,582 | $202,157 | -- | -- |
| 2024 | $3,481 | $196,269 | -- | -- |
| 2023 | $3,481 | $190,553 | $0 | $0 |
| 2022 | $3,202 | $185,003 | $0 | $0 |
| 2021 | $3,083 | $179,615 | $0 | $0 |
| 2020 | $3,028 | $174,384 | $0 | $0 |
| 2019 | $2,884 | $169,305 | $0 | $0 |
| 2018 | $2,819 | $164,374 | $0 | $0 |
| 2017 | $2,748 | $159,586 | $0 | $0 |
| 2016 | $2,656 | $154,938 | $0 | $0 |
| 2015 | $2,565 | $150,425 | $0 | $0 |
| 2014 | $2,491 | $146,044 | $0 | $0 |
Source: Public Records
Map
Nearby Homes
- 580 N Grant St
- 442 NW 4th Ave
- 589 NW 3rd Ave
- 0 NW 10th Ave
- 184 NE 10th Ave
- 812 NW 3rd Ave
- 318 NE 9th Ave
- 850 NW 3rd Ave
- 960 N Aspen Ct
- 916 NW 2nd Ave
- 1198 SW 1st Ave
- 431 SW 3rd Ave
- 187 NE 14th Ave
- 299 SW 3rd Ave
- 978 N Alder St
- 481 S Holly St
- 312 NE 14th Ave
- 248 SE Township Rd
- 574 S Ivy St
- 620 SE 2nd Ave
- 707 N Grant St
- 643 N Grant St
- 348 NW 6th Ave
- 339 N Knights Bridge Rd
- 739 N Grant St
- 680 N Grant St
- 362 NW 6th Ave
- 384 NW 6th Ave
- 290 NW 6th Ave
- 750 N Grant St
- 393 N Knights Bridge Rd
- 251 NW 7th Ave
- 390 NW 6th Ave
- 260 NW 6th Ave
- 312 N Knights Bridge Rd
- 245 NW 7th Ave
- 320 N Knights Bridge Rd
- 400 NW 6th Ave
- 257 N Knights Bridge Rd
- 809 N Grant St