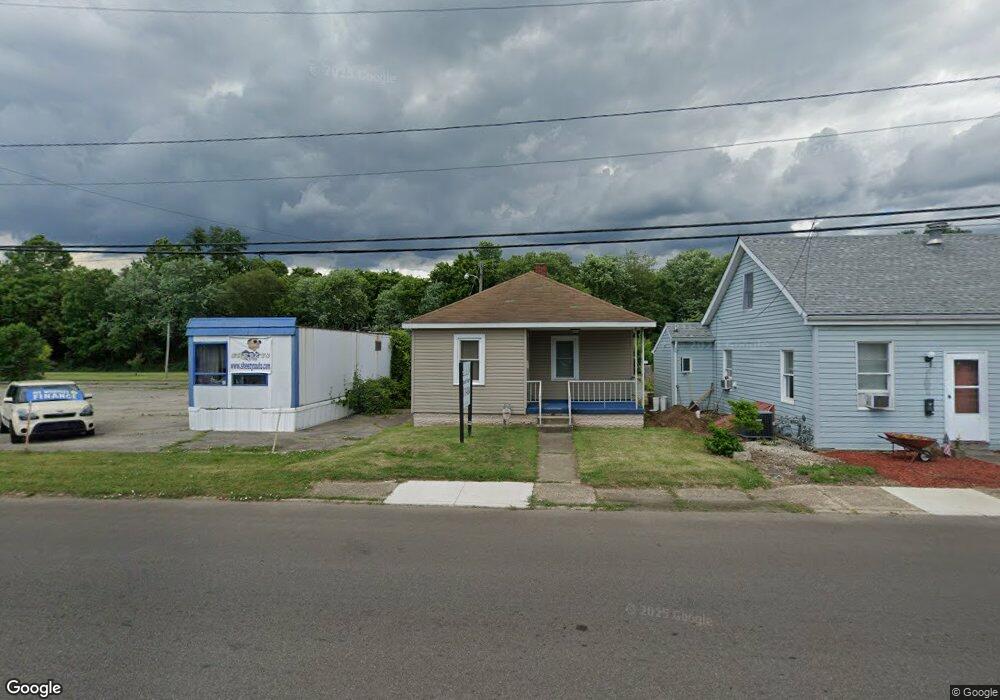
675 N High St Chillicothe, OH 45601
Estimated Value: $86,000 - $121,536
1
Bed
1
Bath
684
Sq Ft
$152/Sq Ft
Est. Value
About This Home
This home is located at 675 N High St, Chillicothe, OH 45601 and is currently estimated at $103,884, approximately $151 per square foot. 675 N High St is a home located in Ross County with nearby schools including Chillicothe High School and Wesley Taylor Preparatory School.
Ownership History
Date
Name
Owned For
Owner Type
Purchase Details
Closed on
Jul 15, 2015
Sold by
Steele Mark and Steele Martha
Bought by
Salyer Amanda and Johnson Nicole Lynn
Current Estimated Value
Home Financials for this Owner
Home Financials are based on the most recent Mortgage that was taken out on this home.
Original Mortgage
$46,000
Interest Rate
5%
Mortgage Type
Seller Take Back
Purchase Details
Closed on
Sep 25, 2009
Sold by
Porter Ollie I
Bought by
Steele Mark and Steele Martha
Create a Home Valuation Report for This Property
The Home Valuation Report is an in-depth analysis detailing your home's value as well as a comparison with similar homes in the area
Home Values in the Area
Average Home Value in this Area
Purchase History
| Date | Buyer | Sale Price | Title Company |
|---|---|---|---|
| Salyer Amanda | $48,000 | None Available | |
| Steele Mark | $21,600 | Attorney |
Source: Public Records
Mortgage History
| Date | Status | Borrower | Loan Amount |
|---|---|---|---|
| Closed | Salyer Amanda | $46,000 |
Source: Public Records
Tax History Compared to Growth
Tax History
| Year | Tax Paid | Tax Assessment Tax Assessment Total Assessment is a certain percentage of the fair market value that is determined by local assessors to be the total taxable value of land and additions on the property. | Land | Improvement |
|---|---|---|---|---|
| 2024 | $679 | $16,650 | $2,770 | $13,880 |
| 2023 | $679 | $16,650 | $2,770 | $13,880 |
| 2022 | $692 | $16,650 | $2,770 | $13,880 |
| 2021 | $616 | $13,010 | $2,490 | $10,520 |
| 2020 | $616 | $13,010 | $2,490 | $10,520 |
| 2019 | $617 | $13,010 | $2,490 | $10,520 |
| 2018 | $551 | $11,010 | $2,490 | $8,520 |
| 2017 | $593 | $11,010 | $2,490 | $8,520 |
| 2016 | $588 | $11,010 | $2,490 | $8,520 |
| 2015 | $540 | $9,860 | $2,490 | $7,370 |
| 2014 | $529 | $9,860 | $2,490 | $7,370 |
| 2013 | $530 | $9,860 | $2,490 | $7,370 |
Source: Public Records
Map
Nearby Homes