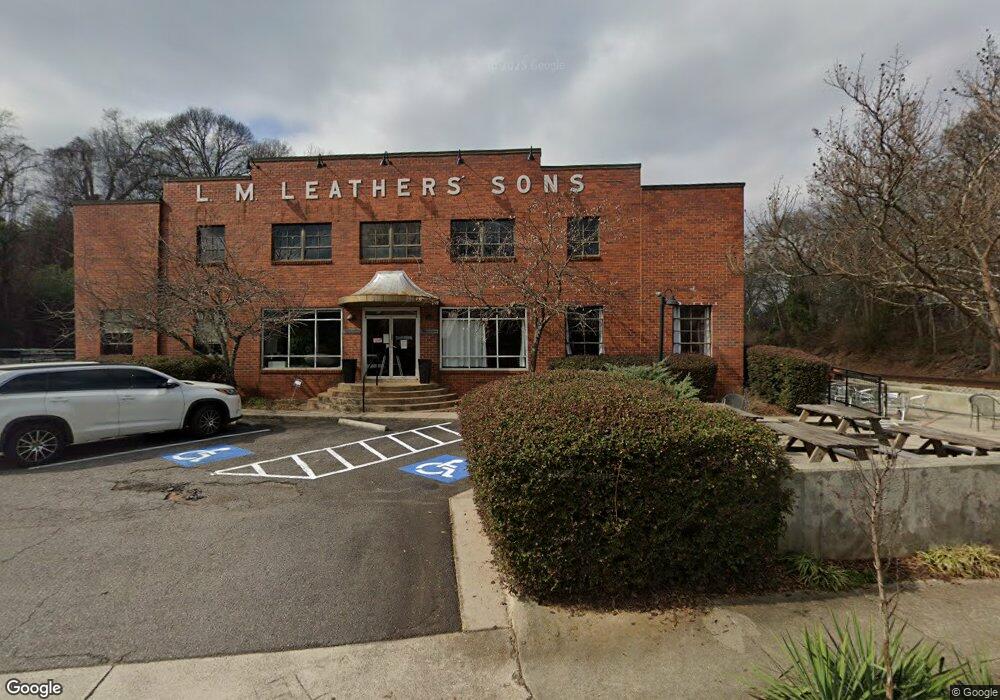
675 Pulaski St Unit 1100 Athens, GA 30601
Newtown NeighborhoodEstimated Value: $307,720
--
Bed
--
Bath
945
Sq Ft
$326/Sq Ft
Est. Value
About This Home
This home is located at 675 Pulaski St Unit 1100, Athens, GA 30601 and is currently estimated at $307,720, approximately $325 per square foot. 675 Pulaski St Unit 1100 is a home located in Clarke County with nearby schools including Johnnie Lay Burks Elementary School, Clarke Middle School, and Clarke Central High School.
Ownership History
Date
Name
Owned For
Owner Type
Purchase Details
Closed on
Dec 15, 2022
Sold by
Schlagely Grp Llc
Bought by
Mcwill Partners Llc
Current Estimated Value
Purchase Details
Closed on
Nov 25, 2019
Sold by
Rolfing Associates Of Athens Llc
Bought by
Schlagely Grp Llc
Home Financials for this Owner
Home Financials are based on the most recent Mortgage that was taken out on this home.
Original Mortgage
$210,000
Interest Rate
3.75%
Mortgage Type
Commercial
Purchase Details
Closed on
Nov 28, 2006
Sold by
Not Provided
Bought by
Rolfing Associates Of Athens L
Home Financials for this Owner
Home Financials are based on the most recent Mortgage that was taken out on this home.
Original Mortgage
$148,920
Interest Rate
6.29%
Create a Home Valuation Report for This Property
The Home Valuation Report is an in-depth analysis detailing your home's value as well as a comparison with similar homes in the area
Home Values in the Area
Average Home Value in this Area
Purchase History
| Date | Buyer | Sale Price | Title Company |
|---|---|---|---|
| Mcwill Partners Llc | $250,000 | -- | |
| Schlagely Grp Llc | $210,000 | -- | |
| Rolfing Associates Of Athens L | $159,900 | -- |
Source: Public Records
Mortgage History
| Date | Status | Borrower | Loan Amount |
|---|---|---|---|
| Previous Owner | Schlagely Grp Llc | $210,000 | |
| Previous Owner | Rolfing Associates Of Athens L | $148,920 |
Source: Public Records
Tax History Compared to Growth
Tax History
| Year | Tax Paid | Tax Assessment Tax Assessment Total Assessment is a certain percentage of the fair market value that is determined by local assessors to be the total taxable value of land and additions on the property. | Land | Improvement |
|---|---|---|---|---|
| 2024 | $2,841 | $91,509 | $15,309 | $76,200 |
| 2023 | $2,860 | $91,509 | $15,309 | $76,200 |
| 2022 | $2,579 | $80,836 | $15,309 | $65,527 |
| 2021 | $2,830 | $83,981 | $15,309 | $68,672 |
| 2020 | $2,795 | $82,933 | $15,309 | $67,624 |
| 2019 | $2,540 | $74,827 | $15,309 | $59,518 |
| 2018 | $2,435 | $71,722 | $10,000 | $61,722 |
| 2017 | $2,210 | $65,109 | $10,000 | $55,109 |
| 2016 | $1,876 | $55,270 | $10,000 | $45,270 |
| 2015 | $1,879 | $55,270 | $10,000 | $45,270 |
| 2014 | $1,882 | $55,270 | $10,000 | $45,270 |
Source: Public Records
Map
Nearby Homes
- 145 Hendrix Ave
- 668 Pulaski St
- 600 Pulaski St
- 143 Barrow St
- 559 Pulaski St
- 270 Atlanta Ave
- 570 Prince Ave
- 195 Beulah Ave
- 257 Hill St
- 269 N Hull St Unit 212
- 118 Ruth Dr Unit 630
- 239 Madison Heights
- 248 Ruth St
- 256 Ruth St
- 239 Ruth St Unit 15
- 131 E Broad St Unit 901
- 248 Fern Ridge Ct
- 249 Fifth St
- 552 Cobb St
- 858 Meigs St
- 675 Pulaski St Unit 2500
- 675 Pulaski St Unit 1
- 675 Pulaski St Unit 120
- 675 Pulaski St Unit 800
- 675 Pulaski St Unit 2200
- 675 Pulaski St Unit 700
- 675 Pulaski St Unit 900
- 675 Pulaski St Unit 1800
- 675 Pulaski St Unit 500
- 675 Pulaski St Unit 1200
- 675 Pulaski St Unit 1300
- 675 Pulaski St Unit 2000
- 675 Pulaski St Unit 400
- 675 Pulaski St Unit 100
- 675 Pulaski St Unit 1900
- 675 Pulaski St Unit 2100
- 675 Pulaski St Unit 2300
- 675 Pulaski St Unit 300
- 675 Pulaski St Unit 600
- 675 Pulaski St Unit 130