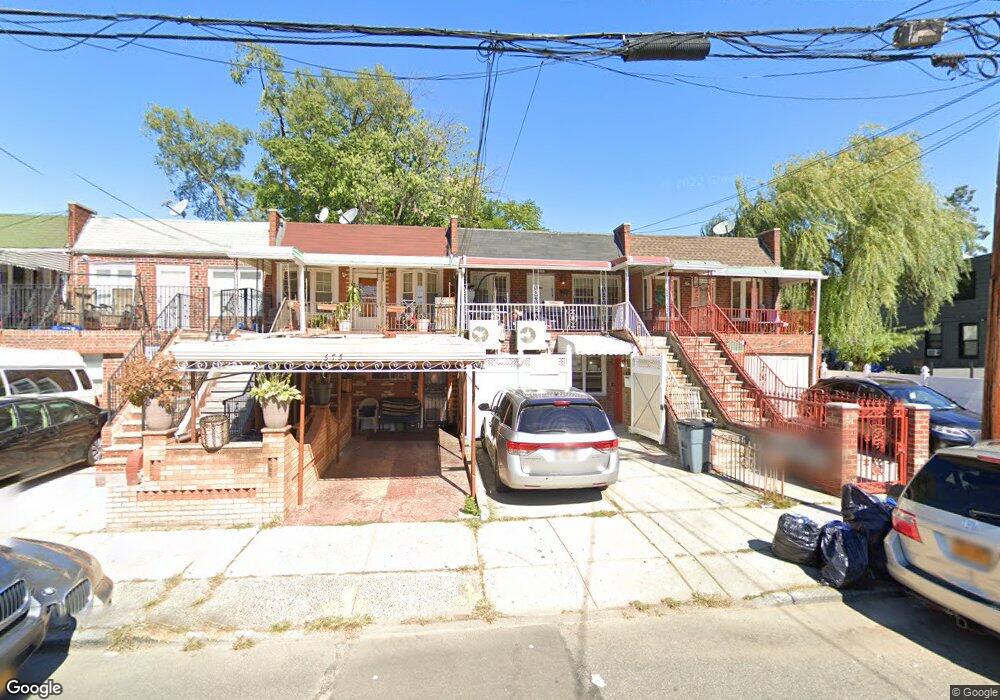
675 Rutland Rd Brooklyn, NY 11203
East Flatbush NeighborhoodEstimated Value: $800,000 - $1,307,000
--
Bed
--
Bath
1,760
Sq Ft
$566/Sq Ft
Est. Value
About This Home
This home is located at 675 Rutland Rd, Brooklyn, NY 11203 and is currently estimated at $995,950, approximately $565 per square foot. 675 Rutland Rd is a home located in Kings County with nearby schools including P.S. 91 The Albany Avenue School, New Heights Middle School, and Bnos Menachem School for Girls.
Ownership History
Date
Name
Owned For
Owner Type
Purchase Details
Closed on
Jun 19, 2018
Sold by
Swird Miryam
Bought by
Chaskind Chanoch
Current Estimated Value
Home Financials for this Owner
Home Financials are based on the most recent Mortgage that was taken out on this home.
Original Mortgage
$0
Interest Rate
4.6%
Mortgage Type
Unknown
Purchase Details
Closed on
Sep 25, 2015
Sold by
Eom Llc
Bought by
Swird Miryam
Home Financials for this Owner
Home Financials are based on the most recent Mortgage that was taken out on this home.
Original Mortgage
$533,850
Interest Rate
3.88%
Mortgage Type
New Conventional
Purchase Details
Closed on
Mar 3, 2015
Sold by
Houlker Larry
Bought by
Eom Llc
Purchase Details
Closed on
Apr 8, 1992
Sold by
Houlker Deowrattee
Bought by
Houlker Larry and Houlker Michelle
Create a Home Valuation Report for This Property
The Home Valuation Report is an in-depth analysis detailing your home's value as well as a comparison with similar homes in the area
Home Values in the Area
Average Home Value in this Area
Purchase History
| Date | Buyer | Sale Price | Title Company |
|---|---|---|---|
| Chaskind Chanoch | -- | -- | |
| Chaskind Chanoch | -- | -- | |
| Swird Miryam | $775,000 | -- | |
| Swird Miryam | $775,000 | -- | |
| Eom Llc | $350,000 | -- | |
| Eom Llc | $350,000 | -- | |
| Houlker Larry | $40,000 | Commonwealth Land Title Ins | |
| Houlker Larry | -- | Commonwealth Land Title Ins |
Source: Public Records
Mortgage History
| Date | Status | Borrower | Loan Amount |
|---|---|---|---|
| Closed | Chaskind Chanoch | $0 | |
| Open | Chaskind Chanoch | $97,205 | |
| Closed | Chaskind Chanoch | $97,205 | |
| Previous Owner | Swird Miryam | $533,850 |
Source: Public Records
Tax History Compared to Growth
Tax History
| Year | Tax Paid | Tax Assessment Tax Assessment Total Assessment is a certain percentage of the fair market value that is determined by local assessors to be the total taxable value of land and additions on the property. | Land | Improvement |
|---|---|---|---|---|
| 2025 | $6,289 | $62,460 | $14,880 | $47,580 |
| 2024 | $6,289 | $49,320 | $14,880 | $34,440 |
| 2023 | $5,999 | $51,000 | $14,880 | $36,120 |
| 2022 | $5,563 | $42,900 | $14,880 | $28,020 |
| 2021 | $5,865 | $44,220 | $14,880 | $29,340 |
| 2020 | $5,865 | $51,900 | $14,880 | $37,020 |
| 2019 | $5,144 | $41,280 | $14,880 | $26,400 |
| 2018 | $5,018 | $24,616 | $9,349 | $15,267 |
| 2017 | $4,734 | $23,223 | $10,805 | $12,418 |
| 2016 | $4,642 | $23,223 | $10,908 | $12,315 |
| 2015 | $2,642 | $23,048 | $12,202 | $10,846 |
| 2014 | $2,642 | $21,744 | $11,511 | $10,233 |
Source: Public Records
Map
Nearby Homes
- 112 E 45th St
- 602 Maple St
- 691 Winthrop St
- 704 Lefferts Ave
- 122 E 46th St
- 770 Lefferts Ave Unit 3R
- 10 E 43rd St Unit 4K
- 10 E 43rd St Unit 5e
- 10 E 43rd St Unit 4J
- 487 Midwood St
- 556 E New York Ave
- 446 Kingston Ave Unit D9
- 755 Albany Ave
- 40 E 43rd St Unit 2K
- 31 E 43rd St
- 625 Lenox Rd
- 589 Lenox Rd
- 750 Troy Ave
- 20 Lamont Ct
- 897 Empire Blvd Unit F6
- 673 Rutland Rd
- 677 Rutland Rd
- 671 Rutland Rd
- 669 Rutland Rd
- 681 Rutland Rd
- 685 Rutland Rd
- 685 Rutland Rd Unit 2
- 665 Rutland Rd Unit 3
- 665 Rutland Rd Unit 2
- 665 Rutland Rd
- 670 Midwood St
- 670 Midwood St Unit 1
- 674 Midwood St
- 668 Midwood St
- 687 Rutland Rd
- 676 Midwood St
- 676 Midwood St Unit 1
- 663 Rutland Rd
- 664 Midwood St
- 678 Midwood St