Estimated Value: $387,489 - $426,000
Studio
--
Bath
1,032
Sq Ft
$398/Sq Ft
Est. Value
About This Home
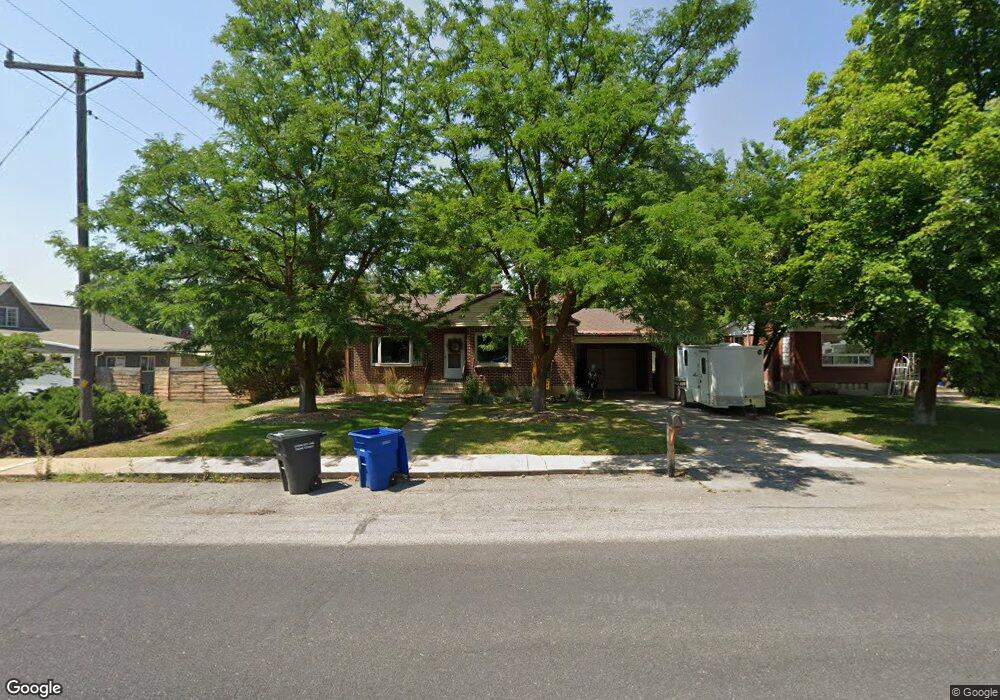
This home is located at 675 S 600 E, Logan, UT 84321 and is currently estimated at $411,122, approximately $398 per square foot. 675 S 600 E is a home with nearby schools including River Heights School, Spring Creek Middle School, and South Cache Middle School.
Ownership History
Date
Name
Owned For
Owner Type
Purchase Details
Closed on
Nov 19, 2021
Sold by
Gibson Natalie
Bought by
Gyllenskog Dane and Gibson Natalie
Current Estimated Value
Home Financials for this Owner
Home Financials are based on the most recent Mortgage that was taken out on this home.
Original Mortgage
$168,000
Outstanding Balance
$142,467
Interest Rate
2.98%
Mortgage Type
New Conventional
Estimated Equity
$268,655
Purchase Details
Closed on
Oct 24, 2016
Sold by
White Ryan T and White Amy
Bought by
Gibson Natalie
Purchase Details
Closed on
Oct 30, 2008
Sold by
White Don Alfred and White Jon Mark
Bought by
White Ryan T and White Amy
Home Financials for this Owner
Home Financials are based on the most recent Mortgage that was taken out on this home.
Original Mortgage
$86,500
Interest Rate
6.07%
Mortgage Type
New Conventional
Create a Home Valuation Report for This Property
The Home Valuation Report is an in-depth analysis detailing your home's value as well as a comparison with similar homes in the area
Purchase History
| Date | Buyer | Sale Price | Title Company |
|---|---|---|---|
| Gyllenskog Dane | -- | American Secure Title Logan | |
| Gibson Natalie | -- | Hickman Land Title | |
| White Ryan T | -- | Hickman Land Title Company | |
| White Ryan T | -- | Hickman Land Title Company |
Source: Public Records
Mortgage History
| Date | Status | Borrower | Loan Amount |
|---|---|---|---|
| Open | Gyllenskog Dane | $168,000 | |
| Previous Owner | White Ryan T | $86,500 |
Source: Public Records
Tax History
| Year | Tax Paid | Tax Assessment Tax Assessment Total Assessment is a certain percentage of the fair market value that is determined by local assessors to be the total taxable value of land and additions on the property. | Land | Improvement |
|---|---|---|---|---|
| 2025 | $1,582 | $241,645 | $0 | $0 |
| 2024 | $1,701 | $240,915 | $0 | $0 |
| 2023 | $1,795 | $238,440 | $0 | $0 |
| 2022 | $1,561 | $197,190 | $0 | $0 |
| 2021 | $1,436 | $278,540 | $50,000 | $228,540 |
| 2020 | $1,241 | $225,800 | $50,000 | $175,800 |
| 2019 | $1,309 | $225,800 | $50,000 | $175,800 |
| 2018 | $971 | $161,552 | $50,000 | $111,552 |
| 2017 | $897 | $77,880 | $0 | $0 |
| 2016 | $913 | $77,880 | $0 | $0 |
| 2015 | $914 | $77,880 | $0 | $0 |
| 2014 | $890 | $77,880 | $0 | $0 |
| 2013 | -- | $69,735 | $0 | $0 |
Source: Public Records
Map
Nearby Homes
- 694 S 600 E
- 716 S 600 E
- 821 S 525 E
- 560 750 E Unit 39
- 503 750 E Unit 31
- 415 750 E Unit 24
- 540 750 E Unit 41
- 550 750 E Unit 40
- 27 W Spring Creek Pkwy
- 665 E 400 S
- 23 Andrews Ln
- 808 S Stone Creek Dr
- 192 E 610 N
- 192 E 610 N Unit 417
- 175 E 550 N
- 315 Mountain View Ln
- 124 Andrew's Ln
- 188 E 520 N
- 434 River Heights Blvd
- 66 E Springs Ln