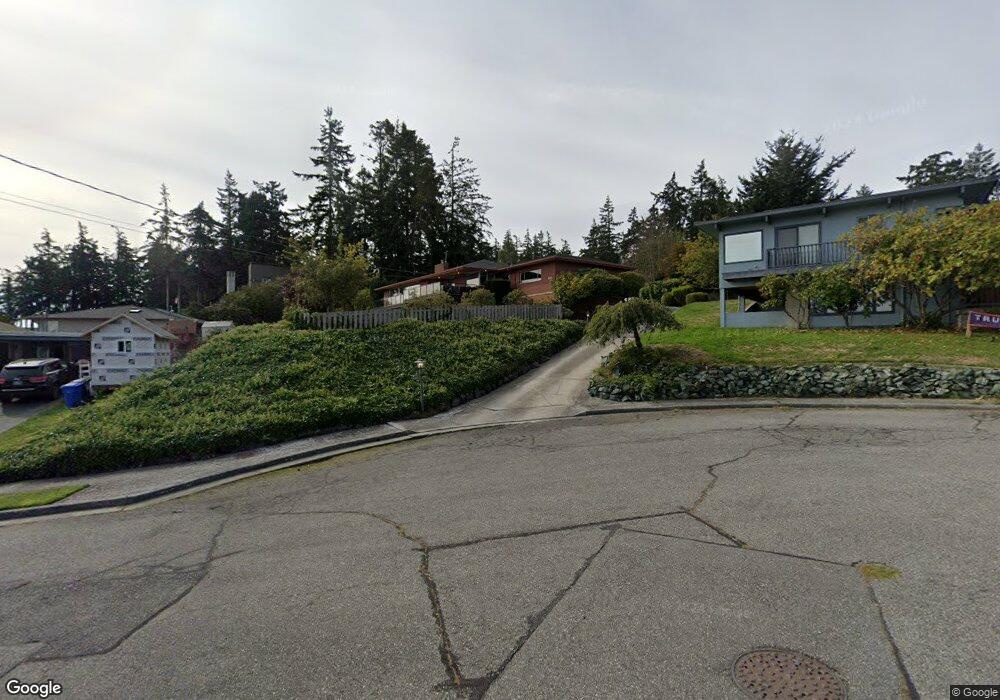
675 SW Franklin Ct Oak Harbor, WA 98277
Estimated Value: $717,000 - $924,000
4
Beds
3
Baths
3,027
Sq Ft
$258/Sq Ft
Est. Value
About This Home
This home is located at 675 SW Franklin Ct, Oak Harbor, WA 98277 and is currently estimated at $781,739, approximately $258 per square foot. 675 SW Franklin Ct is a home located in Island County with nearby schools including Broadview Elementary School, Oak Harbor Middle School, and Oak Harbor High School.
Ownership History
Date
Name
Owned For
Owner Type
Purchase Details
Closed on
Feb 10, 2012
Sold by
Hastings Karen Page
Bought by
Lof Douglas V A and Lof Susan S
Current Estimated Value
Home Financials for this Owner
Home Financials are based on the most recent Mortgage that was taken out on this home.
Original Mortgage
$327,845
Outstanding Balance
$223,250
Interest Rate
3.84%
Mortgage Type
VA
Estimated Equity
$558,489
Purchase Details
Closed on
Apr 4, 2007
Sold by
Buckley William M and Hastings Karen Page
Bought by
Buckley William M and Hastings Karen Page
Purchase Details
Closed on
Jan 4, 2006
Sold by
Osterholt Richard A and Osterholt Elizabeth T
Bought by
Buckley William M and Hastings Karen Page
Purchase Details
Closed on
Aug 25, 2005
Sold by
Jensen Kenneth S and Lang Marvin
Bought by
Buckley William M and Hastings Karen Page
Home Financials for this Owner
Home Financials are based on the most recent Mortgage that was taken out on this home.
Original Mortgage
$180,000
Interest Rate
5.61%
Mortgage Type
New Conventional
Create a Home Valuation Report for This Property
The Home Valuation Report is an in-depth analysis detailing your home's value as well as a comparison with similar homes in the area
Home Values in the Area
Average Home Value in this Area
Purchase History
| Date | Buyer | Sale Price | Title Company |
|---|---|---|---|
| Lof Douglas V A | $340,000 | Land Title Escrow Island Co | |
| Buckley William M | -- | None Available | |
| Buckley William M | -- | None Available | |
| Buckley William M | $360,000 | Chicago Title Co Island Div |
Source: Public Records
Mortgage History
| Date | Status | Borrower | Loan Amount |
|---|---|---|---|
| Open | Lof Douglas V A | $327,845 | |
| Previous Owner | Buckley William M | $180,000 |
Source: Public Records
Tax History Compared to Growth
Tax History
| Year | Tax Paid | Tax Assessment Tax Assessment Total Assessment is a certain percentage of the fair market value that is determined by local assessors to be the total taxable value of land and additions on the property. | Land | Improvement |
|---|---|---|---|---|
| 2025 | $5,737 | $670,559 | $250,000 | $420,559 |
| 2024 | $5,655 | $676,461 | $250,000 | $426,461 |
| 2023 | $5,655 | $670,559 | $250,000 | $420,559 |
| 2022 | $5,413 | $626,160 | $240,000 | $386,160 |
| 2021 | $5,088 | $505,039 | $175,000 | $330,039 |
| 2020 | $5,011 | $473,210 | $150,000 | $323,210 |
| 2019 | $4,124 | $461,276 | $200,000 | $261,276 |
| 2018 | $4,302 | $412,168 | $150,000 | $262,168 |
| 2017 | $3,813 | $378,971 | $125,000 | $253,971 |
| 2016 | $3,726 | $357,499 | $100,000 | $257,499 |
| 2015 | $3,842 | $336,026 | $75,000 | $261,026 |
| 2013 | -- | $343,080 | $75,000 | $268,080 |
Source: Public Records
Map
Nearby Homes
- 1101 SW Harrier Cir Unit 106
- 660 SW Harrier Cir Unit 1
- 984 SW 6th Ave
- 478 SW Judson Dr
- 942 SW Barrington Dr
- 1121 SW Barrington Dr Unit 3
- 1250 SW Heller Rd Unit C1
- 1250 SW Heller St Unit B2
- 356 SW Judson Dr
- 1238 SW Lopez Dr
- 748 SW Heller St
- 185 SW 3rd Ave
- 1380 SW Swantown Ave
- 30901 State Route 20 Unit D2
- 280 SW Ballast Way
- 485 SW Bayshore Dr Unit C201
- 1472 SW 10th Ave
- 1075 SW 2nd Ave
- 915 SW Kimball Dr Unit B3
- 1850 SW Scenic Heights St Unit B304
- 953 SW Fleet St
- 931 SW Fleet St
- 936 SW Fairhaven Dr
- 699 SW Franklin Ct
- 898 SW Fairhaven Dr
- 985 SW Fleet St
- 960 SW Fairhaven Dr
- 698 SW Franklin Ct
- 674 SW Franklin Ct
- 640 SW Franklin Ct
- 996 SW Fairhaven Dr
- 960 SW Fleet St
- 930 SW Fleet St
- 1031 SW Fleet St
- 721 SW Castilian Dr
- 891 SW Fairhaven Dr
- 898 SW Fleet St
- 955 SW Fairhaven Dr
- 1000 SW Fleet St
- 790 SW Echo Loop