Estimated Value: $149,000 - $204,000
4
Beds
2
Baths
988
Sq Ft
$179/Sq Ft
Est. Value
About This Home
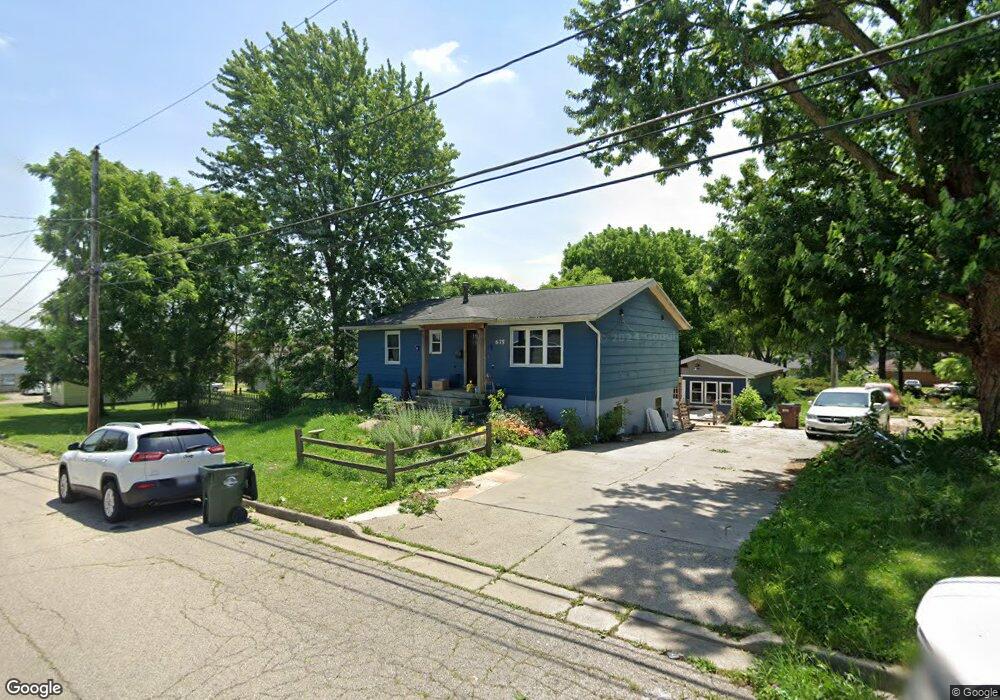
This home is located at 675 Trumbull St, Xenia, OH 45385 and is currently estimated at $176,897, approximately $179 per square foot. 675 Trumbull St is a home located in Greene County with nearby schools including Xenia High School, Summit Academy Community School for Alternative Learners - Xenia, and Legacy Christian Academy.
Ownership History
Date
Name
Owned For
Owner Type
Purchase Details
Closed on
Dec 3, 2019
Sold by
First National Acceptance Company
Bought by
Hutchison Jeremy and Hutchison Kristi
Current Estimated Value
Home Financials for this Owner
Home Financials are based on the most recent Mortgage that was taken out on this home.
Original Mortgage
$63,500
Outstanding Balance
$43,204
Interest Rate
3.7%
Mortgage Type
New Conventional
Estimated Equity
$133,693
Purchase Details
Closed on
Jun 25, 2015
Sold by
Moore Virginia M and Parker Sandra
Bought by
First National Acceptance Company
Purchase Details
Closed on
Sep 22, 2003
Sold by
Moore Virginia M
Bought by
Hutchison Jeremy and Hutchison Kristi
Home Financials for this Owner
Home Financials are based on the most recent Mortgage that was taken out on this home.
Original Mortgage
$119,000
Interest Rate
3%
Mortgage Type
Seller Take Back
Create a Home Valuation Report for This Property
The Home Valuation Report is an in-depth analysis detailing your home's value as well as a comparison with similar homes in the area
Home Values in the Area
Average Home Value in this Area
Purchase History
| Date | Buyer | Sale Price | Title Company |
|---|---|---|---|
| Hutchison Jeremy | $119,000 | None Available | |
| First National Acceptance Company | $52,700 | Attorney | |
| Hutchison Jeremy | $119,000 | -- |
Source: Public Records
Mortgage History
| Date | Status | Borrower | Loan Amount |
|---|---|---|---|
| Open | Hutchison Jeremy | $63,500 | |
| Previous Owner | Hutchison Jeremy | $119,000 |
Source: Public Records
Tax History Compared to Growth
Tax History
| Year | Tax Paid | Tax Assessment Tax Assessment Total Assessment is a certain percentage of the fair market value that is determined by local assessors to be the total taxable value of land and additions on the property. | Land | Improvement |
|---|---|---|---|---|
| 2024 | $1,879 | $43,900 | $5,690 | $38,210 |
| 2023 | $1,879 | $43,900 | $5,690 | $38,210 |
| 2022 | $1,664 | $33,170 | $4,550 | $28,620 |
| 2021 | $1,686 | $33,170 | $4,550 | $28,620 |
| 2020 | $1,652 | $33,170 | $4,550 | $28,620 |
| 2019 | $1,652 | $31,920 | $5,000 | $26,920 |
| 2018 | $1,658 | $31,920 | $5,000 | $26,920 |
| 2017 | $1,677 | $31,920 | $5,000 | $26,920 |
| 2016 | $1,590 | $30,030 | $5,000 | $25,030 |
| 2015 | $1,552 | $30,030 | $5,000 | $25,030 |
| 2014 | $1,522 | $30,030 | $5,000 | $25,030 |
Source: Public Records
Map
Nearby Homes
- 676 Trumbull St
- 666 Trumbull St
- 645 Trumbull St
- 704 Trumbull St
- 729 Trumbull St
- 716 Trumbull St
- 346 Bellbrook Ave
- 663 W 2nd St
- 651 W 2nd St
- 358 Bellbrook Ave
- 724 Trumbull St
- 681 W 2nd St
- 681 W 2nd St Unit 683
- 673 W 2nd St
- 703 W 2nd St
- 687 W 2nd St
- 701 W 2nd St
- 711 Trumbull St
- 705 W 2nd St
- 739 Trumbull St