Estimated Value: $480,000 - $548,000
2
Beds
1
Bath
1,195
Sq Ft
$433/Sq Ft
Est. Value
About This Home
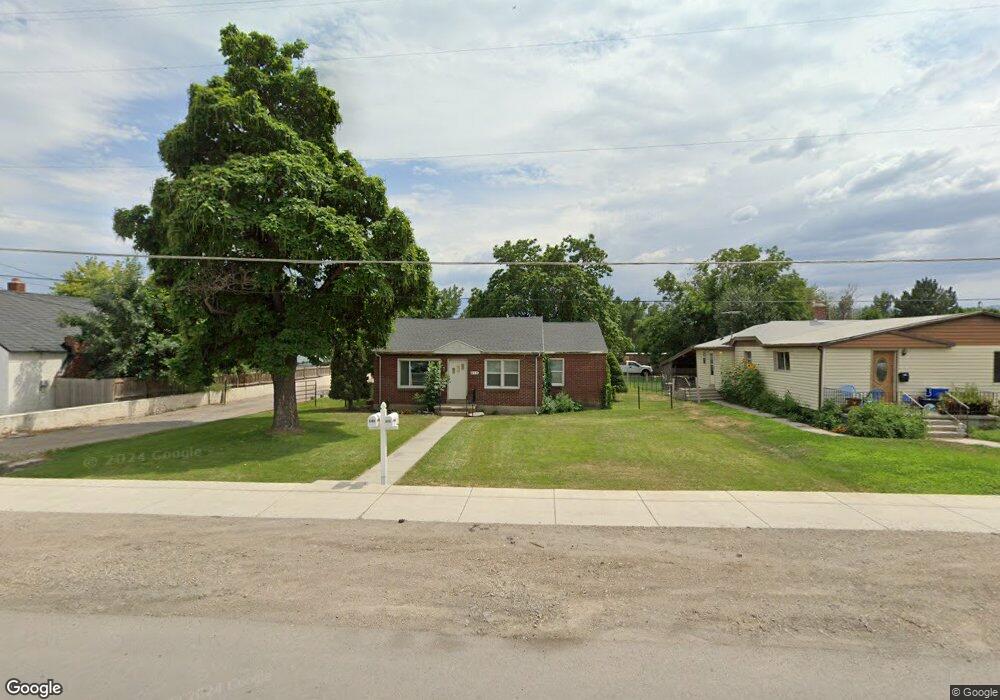
This home is located at 675 W Main St, Lehi, UT 84043 and is currently estimated at $517,250, approximately $432 per square foot. 675 W Main St is a home located in Utah County with nearby schools including Meadow Elementary School, Lehi Junior High School, and Lehi High School.
Ownership History
Date
Name
Owned For
Owner Type
Purchase Details
Closed on
May 10, 2022
Sold by
Long Bradley D
Bought by
Bdl Structures Llc
Current Estimated Value
Home Financials for this Owner
Home Financials are based on the most recent Mortgage that was taken out on this home.
Original Mortgage
$283,940
Outstanding Balance
$267,835
Interest Rate
5.27%
Mortgage Type
New Conventional
Estimated Equity
$249,415
Purchase Details
Closed on
Dec 14, 2006
Sold by
Southwest Trust Co
Bought by
Long Bradley D
Home Financials for this Owner
Home Financials are based on the most recent Mortgage that was taken out on this home.
Original Mortgage
$132,000
Interest Rate
6.32%
Mortgage Type
New Conventional
Purchase Details
Closed on
Nov 8, 2005
Sold by
Taylor Bryce K
Bought by
Nimbus Properties Lc
Purchase Details
Closed on
May 18, 2005
Sold by
Western National Trust Co
Bought by
Southwest Trust Co
Create a Home Valuation Report for This Property
The Home Valuation Report is an in-depth analysis detailing your home's value as well as a comparison with similar homes in the area
Home Values in the Area
Average Home Value in this Area
Purchase History
| Date | Buyer | Sale Price | Title Company |
|---|---|---|---|
| Bdl Structures Llc | -- | Cottonwood Title | |
| Long Bradley D | -- | Gt Title Services Spanish | |
| Nimbus Properties Lc | -- | Old Republic Title Co Of Ut | |
| Southwest Trust Co | -- | -- |
Source: Public Records
Mortgage History
| Date | Status | Borrower | Loan Amount |
|---|---|---|---|
| Open | Bdl Structures Llc | $283,940 | |
| Previous Owner | Long Bradley D | $132,000 |
Source: Public Records
Tax History
| Year | Tax Paid | Tax Assessment Tax Assessment Total Assessment is a certain percentage of the fair market value that is determined by local assessors to be the total taxable value of land and additions on the property. | Land | Improvement |
|---|---|---|---|---|
| 2025 | $1,900 | $232,815 | -- | -- |
| 2024 | $1,900 | $222,310 | $0 | $0 |
| 2023 | $1,766 | $224,345 | $0 | $0 |
| 2022 | $1,815 | $223,630 | $0 | $0 |
| 2021 | $1,562 | $290,900 | $133,100 | $157,800 |
| 2020 | $1,471 | $270,700 | $123,200 | $147,500 |
| 2019 | $1,314 | $251,500 | $123,200 | $128,300 |
| 2018 | $1,314 | $237,700 | $114,400 | $123,300 |
| 2017 | $1,169 | $112,420 | $0 | $0 |
| 2016 | $1,039 | $92,730 | $0 | $0 |
| 2015 | $1,067 | $90,365 | $0 | $0 |
| 2014 | $1,019 | $85,800 | $0 | $0 |
Source: Public Records
Map
Nearby Homes
Your Personal Tour Guide
Ask me questions while you tour the home.