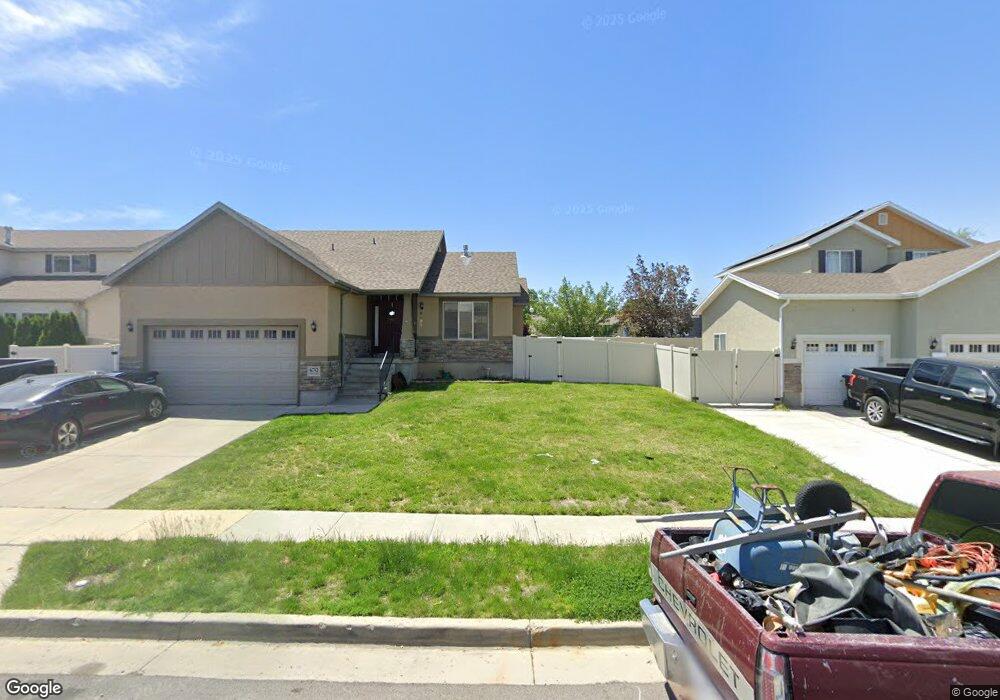
6752 Majestic Loop Rd West Jordan, UT 84081
Oquirrh NeighborhoodEstimated Value: $570,000 - $635,000
4
Beds
3
Baths
1,848
Sq Ft
$321/Sq Ft
Est. Value
About This Home
This home is located at 6752 Majestic Loop Rd, West Jordan, UT 84081 and is currently estimated at $593,777, approximately $321 per square foot. 6752 Majestic Loop Rd is a home located in Salt Lake County with nearby schools including Mountain Shadows School, West Hills Middle School, and Copper Hills High School.
Ownership History
Date
Name
Owned For
Owner Type
Purchase Details
Closed on
Nov 2, 2017
Sold by
Nakagama Christopher
Bought by
Ah4r Properties Llc
Current Estimated Value
Purchase Details
Closed on
Sep 4, 2015
Sold by
Nakagama Christopher
Bought by
Nakagama Christopher
Purchase Details
Closed on
Mar 28, 2012
Sold by
Beebe Brian A and Beebe Karen R
Bought by
Nakagama Christopher
Home Financials for this Owner
Home Financials are based on the most recent Mortgage that was taken out on this home.
Original Mortgage
$195,700
Interest Rate
3.83%
Mortgage Type
New Conventional
Purchase Details
Closed on
Aug 1, 2006
Sold by
Reliance Homes Inc
Bought by
Beebe Brian A and Beebe Karen R
Home Financials for this Owner
Home Financials are based on the most recent Mortgage that was taken out on this home.
Original Mortgage
$48,985
Interest Rate
6.76%
Mortgage Type
Stand Alone Second
Create a Home Valuation Report for This Property
The Home Valuation Report is an in-depth analysis detailing your home's value as well as a comparison with similar homes in the area
Home Values in the Area
Average Home Value in this Area
Purchase History
| Date | Buyer | Sale Price | Title Company |
|---|---|---|---|
| Ah4r Properties Llc | -- | Inwest Title Services Slc | |
| Nakagama Christopher | -- | Highland Title Agency | |
| Nakagama Christopher | -- | Artisan Title | |
| Beebe Brian A | -- | Merrill Title | |
| Reliance Homes Inc | -- | Merrill Title |
Source: Public Records
Mortgage History
| Date | Status | Borrower | Loan Amount |
|---|---|---|---|
| Previous Owner | Nakagama Christopher | $195,700 | |
| Previous Owner | Reliance Homes Inc | $48,985 | |
| Previous Owner | Beebe Brian A | $195,943 |
Source: Public Records
Tax History Compared to Growth
Tax History
| Year | Tax Paid | Tax Assessment Tax Assessment Total Assessment is a certain percentage of the fair market value that is determined by local assessors to be the total taxable value of land and additions on the property. | Land | Improvement |
|---|---|---|---|---|
| 2025 | $3,354 | $601,300 | $114,900 | $486,400 |
| 2024 | $3,354 | $567,000 | $108,400 | $458,600 |
| 2023 | $3,359 | $533,400 | $104,200 | $429,200 |
| 2022 | $3,310 | $522,500 | $102,200 | $420,300 |
| 2021 | $2,895 | $424,300 | $78,600 | $345,700 |
| 2020 | $2,718 | $372,100 | $78,600 | $293,500 |
| 2019 | $2,674 | $358,000 | $74,200 | $283,800 |
| 2018 | $2,512 | $331,900 | $74,200 | $257,700 |
| 2017 | $2,406 | $313,200 | $74,200 | $239,000 |
| 2016 | $2,361 | $289,100 | $74,200 | $214,900 |
| 2015 | -- | $265,000 | $73,900 | $191,100 |
| 2014 | $2,032 | $235,800 | $71,800 | $164,000 |
Source: Public Records
Map
Nearby Homes
- 4891 Calyx Cir
- 4785 Foggio Ct
- 4888 Ticklegrass Rd
- 4790 W Barletta Ct
- 6811 S Etruscan Way
- 4983 Shooting Star Ave
- 4763 W Arno Way
- 6900 S Florentine Way
- 6706 Marshrock Rd
- 4909 Sakura Ct
- 6983 Florentine Way
- 6635 S Milfoil Cir
- 7071 S Kristilyn Ln
- 6928 Beargrass Rd
- 7138 S Brittany Town Dr
- 7093 S Greensand Dr
- 5183 W Cadenza Dr
- 7173 S Kristilyn Ln
- 6437 S Lobelia Dr
- 6568 S 5180 W
- 6752 S Majestic Loop Rd
- 6758 S Majestic Loop Rd
- 6742 Majestic Loop Rd
- 6758 Majestic Loop Rd
- 6742 S Majestic Loop Rd
- 6734 Majestic Loop Rd
- 6767 S Majestic Loop Rd
- 6734 S Majestic Loop Rd
- 6767 Majestic Loop Rd
- 6768 S Majestic Loop Rd
- 6768 Majestic Loop Rd
- 6755 S Majestic Loop Rd
- 6755 Majestic Loop Rd
- 6777 S Majestic Loop Rd Unit 253
- 6777 Majestic Loop Rd
- 6765 Shooting Star Ave
- 4895 W Shooting Star Ave
- 6743 Majestic Loop Rd
- 6743 S Majestic Loop Rd
- 6759 S Shooting Star Ave