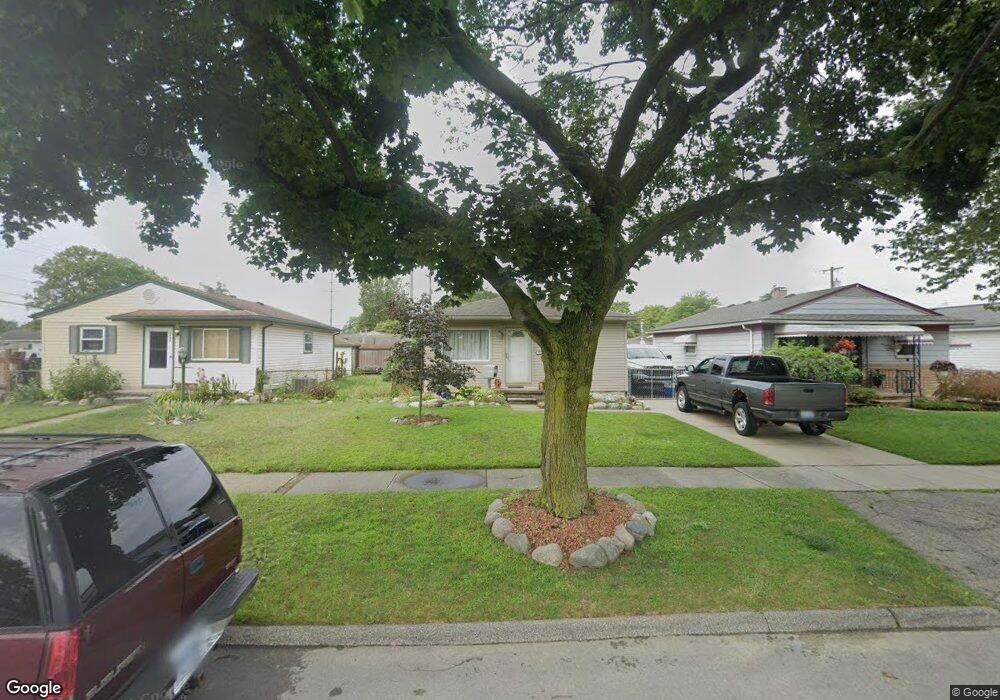
6752 Oak St Taylor, MI 48180
Estimated Value: $139,000 - $154,000
3
Beds
1
Bath
854
Sq Ft
$174/Sq Ft
Est. Value
About This Home
This home is located at 6752 Oak St, Taylor, MI 48180 and is currently estimated at $148,755, approximately $174 per square foot. 6752 Oak St is a home located in Wayne County with nearby schools including Clarence Randall Elementary School, Hoover Middle School, and Quest Charter Academy.
Ownership History
Date
Name
Owned For
Owner Type
Purchase Details
Closed on
Apr 21, 2010
Sold by
Donovan Shaun and Secretary Of Housing & Urban D
Bought by
Hopkins Theresa
Current Estimated Value
Purchase Details
Closed on
Dec 30, 2009
Sold by
Pnc Bank National Association
Bought by
The Secretary Of Housing & Urban Develop
Purchase Details
Closed on
May 7, 2009
Sold by
Saunders Dale A
Bought by
National City Real Estate Services Llc
Purchase Details
Closed on
Mar 24, 2003
Sold by
Saunders Dale and Saunders Julie
Bought by
Saunders Dale
Purchase Details
Closed on
Jan 26, 1999
Sold by
Wanamaker Eileen M
Bought by
Saunders Dale A
Create a Home Valuation Report for This Property
The Home Valuation Report is an in-depth analysis detailing your home's value as well as a comparison with similar homes in the area
Home Values in the Area
Average Home Value in this Area
Purchase History
| Date | Buyer | Sale Price | Title Company |
|---|---|---|---|
| Hopkins Theresa | $27,509 | None Available | |
| The Secretary Of Housing & Urban Develop | -- | None Available | |
| National City Real Estate Services Llc | $121,717 | None Available | |
| Saunders Dale | $8,500 | -- | |
| Saunders Dale A | $83,009 | -- |
Source: Public Records
Tax History Compared to Growth
Tax History
| Year | Tax Paid | Tax Assessment Tax Assessment Total Assessment is a certain percentage of the fair market value that is determined by local assessors to be the total taxable value of land and additions on the property. | Land | Improvement |
|---|---|---|---|---|
| 2025 | $1,885 | $71,600 | $0 | $0 |
| 2024 | $1,885 | $63,000 | $0 | $0 |
| 2023 | $2,122 | $55,800 | $0 | $0 |
| 2022 | $1,773 | $49,600 | $0 | $0 |
| 2021 | $1,404 | $44,700 | $0 | $0 |
| 2020 | $1,390 | $41,000 | $0 | $0 |
| 2019 | $138,972 | $33,800 | $0 | $0 |
| 2018 | $1,093 | $26,900 | $0 | $0 |
| 2017 | $600 | $27,400 | $0 | $0 |
| 2016 | $1,356 | $26,600 | $0 | $0 |
| 2015 | $2,470 | $24,700 | $0 | $0 |
| 2013 | $2,510 | $26,100 | $0 | $0 |
| 2012 | $1,114 | $25,400 | $7,300 | $18,100 |
Source: Public Records
Map
Nearby Homes