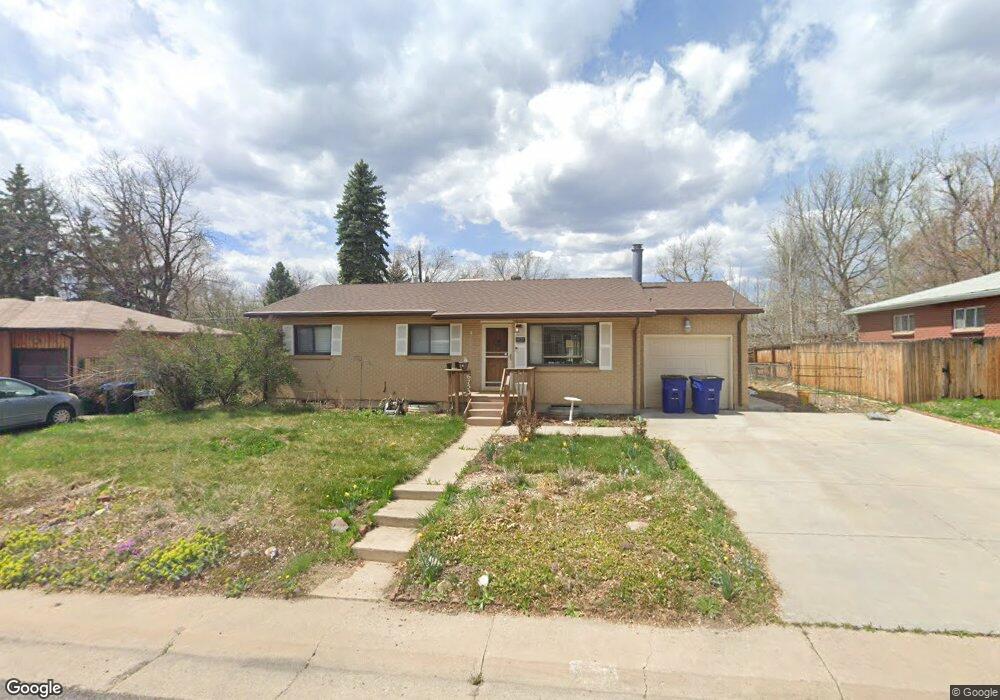
6753 Kipling St Arvada, CO 80004
Alta Vista NeighborhoodEstimated Value: $573,000 - $615,000
4
Beds
3
Baths
2,292
Sq Ft
$259/Sq Ft
Est. Value
About This Home
This home is located at 6753 Kipling St, Arvada, CO 80004 and is currently estimated at $594,726, approximately $259 per square foot. 6753 Kipling St is a home located in Jefferson County with nearby schools including Fremont Elementary School, Oberon Middle School, and Arvada West High School.
Ownership History
Date
Name
Owned For
Owner Type
Purchase Details
Closed on
Jan 16, 2020
Sold by
Roberts Lynn V
Bought by
Jensen Kristine Lynne
Current Estimated Value
Home Financials for this Owner
Home Financials are based on the most recent Mortgage that was taken out on this home.
Original Mortgage
$274,900
Outstanding Balance
$243,492
Interest Rate
3.73%
Mortgage Type
New Conventional
Estimated Equity
$351,234
Purchase Details
Closed on
Apr 26, 2018
Sold by
Loyd Dwayne L and Loyd Nadine L
Bought by
Roberts Lynn V
Home Financials for this Owner
Home Financials are based on the most recent Mortgage that was taken out on this home.
Original Mortgage
$338,300
Interest Rate
4.44%
Mortgage Type
New Conventional
Create a Home Valuation Report for This Property
The Home Valuation Report is an in-depth analysis detailing your home's value as well as a comparison with similar homes in the area
Home Values in the Area
Average Home Value in this Area
Purchase History
| Date | Buyer | Sale Price | Title Company |
|---|---|---|---|
| Jensen Kristine Lynne | $424,900 | Homestead Title & Escrow | |
| Roberts Lynn V | $398,000 | Chicago Title |
Source: Public Records
Mortgage History
| Date | Status | Borrower | Loan Amount |
|---|---|---|---|
| Open | Jensen Kristine Lynne | $274,900 | |
| Previous Owner | Roberts Lynn V | $338,300 |
Source: Public Records
Tax History
| Year | Tax Paid | Tax Assessment Tax Assessment Total Assessment is a certain percentage of the fair market value that is determined by local assessors to be the total taxable value of land and additions on the property. | Land | Improvement |
|---|---|---|---|---|
| 2024 | $3,475 | $35,826 | $15,997 | $19,829 |
| 2023 | $3,475 | $35,826 | $15,997 | $19,829 |
| 2022 | $2,846 | $29,060 | $11,837 | $17,223 |
| 2021 | $2,893 | $29,897 | $12,178 | $17,719 |
| 2020 | $2,414 | $25,015 | $9,486 | $15,529 |
| 2019 | $2,381 | $25,015 | $9,486 | $15,529 |
| 2018 | $1,442 | $21,927 | $6,353 | $15,574 |
| 2017 | $1,320 | $21,927 | $6,353 | $15,574 |
| 2016 | $962 | $17,957 | $5,539 | $12,418 |
| 2015 | $736 | $17,957 | $5,539 | $12,418 |
| 2014 | $736 | $14,535 | $4,872 | $9,663 |
Source: Public Records
Map
Nearby Homes
- 6648 Lewis St
- 6816 Miller St
- 6641 Miller St
- 6551 Miller St
- 6457 Lee St
- 6836 Newcombe St
- 10710 W 66th Ave
- 9909 W 70th Ave
- 6965 Independence St
- 9369 W 67th Ave
- 6371 Brooks Dr
- 6823 Garland St
- 9303 W 66th Place
- 6428 Newcombe St Unit A
- 6393 Moore Ct
- 6745 Garrison St
- 10879 W 65th Way
- 10915 W 68th Ave
- 11023 W 67th Way
- 10785 W 63rd Place Unit 105
- 6733 Kipling St
- 6773 Kipling St
- 6754 Kline St
- 6774 Kline St
- 6713 Kipling St
- 6793 Kipling St
- 6752 Kipling St
- 6732 Kipling St
- 6714 Kline St
- 6772 Kipling St
- 6794 Kline St
- 6712 Kipling St
- 6792 Kipling St
- 6703 Kipling St
- 6704 Kline St
- 6755 Kline St
- 6735 Kline St
- 6775 Kline St
- 6702 Kipling St
- 6715 Kline St
Your Personal Tour Guide
Ask me questions while you tour the home.