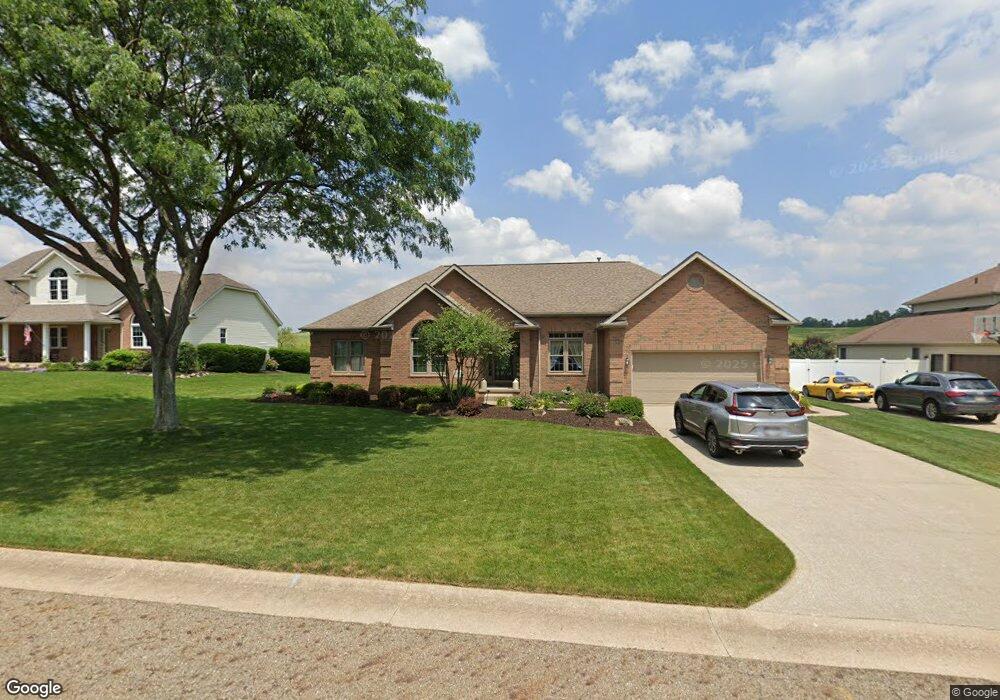
6753 Thicket St NW Canton, OH 44708
Glenmoor NeighborhoodEstimated Value: $355,000 - $392,000
3
Beds
2
Baths
2,162
Sq Ft
$173/Sq Ft
Est. Value
About This Home
This home is located at 6753 Thicket St NW, Canton, OH 44708 and is currently estimated at $373,512, approximately $172 per square foot. 6753 Thicket St NW is a home located in Stark County with nearby schools including Amherst Elementary School, Jackson Memorial Middle School, and Jackson High School.
Ownership History
Date
Name
Owned For
Owner Type
Purchase Details
Closed on
Mar 1, 2023
Sold by
Ruwadi Douglas R
Bought by
Ruwadi Family Irrevocable Trust
Current Estimated Value
Purchase Details
Closed on
Sep 12, 2005
Sold by
Ruwadi Douglas R and Ruwadi Donna M
Bought by
Ruwadi Douglas R and Ruwadi Donna M
Purchase Details
Closed on
Feb 26, 2002
Sold by
Mcguire Janet K
Bought by
Ruwadi Douglas R and Ruwadi Donna M
Home Financials for this Owner
Home Financials are based on the most recent Mortgage that was taken out on this home.
Original Mortgage
$120,000
Interest Rate
6.92%
Mortgage Type
Purchase Money Mortgage
Purchase Details
Closed on
Dec 18, 1995
Sold by
Wilson Bruce
Bought by
Mcguire Janet
Home Financials for this Owner
Home Financials are based on the most recent Mortgage that was taken out on this home.
Original Mortgage
$102,000
Interest Rate
7.45%
Mortgage Type
New Conventional
Purchase Details
Closed on
Apr 25, 1995
Sold by
Edt Properties Inc
Bought by
Wilson Bruce
Create a Home Valuation Report for This Property
The Home Valuation Report is an in-depth analysis detailing your home's value as well as a comparison with similar homes in the area
Home Values in the Area
Average Home Value in this Area
Purchase History
| Date | Buyer | Sale Price | Title Company |
|---|---|---|---|
| Ruwadi Family Irrevocable Trust | -- | -- | |
| Ruwadi Douglas R | -- | -- | |
| Ruwadi Douglas R | $227,000 | -- | |
| Mcguire Janet | $227,000 | -- | |
| Wilson Bruce | $43,900 | -- |
Source: Public Records
Mortgage History
| Date | Status | Borrower | Loan Amount |
|---|---|---|---|
| Previous Owner | Ruwadi Douglas R | $120,000 | |
| Previous Owner | Mcguire Janet | $102,000 |
Source: Public Records
Tax History Compared to Growth
Tax History
| Year | Tax Paid | Tax Assessment Tax Assessment Total Assessment is a certain percentage of the fair market value that is determined by local assessors to be the total taxable value of land and additions on the property. | Land | Improvement |
|---|---|---|---|---|
| 2025 | -- | $108,960 | $26,850 | $82,110 |
| 2024 | -- | $108,960 | $26,850 | $82,110 |
| 2023 | $4,379 | $87,750 | $20,370 | $67,380 |
| 2022 | $4,357 | $87,750 | $20,370 | $67,380 |
| 2021 | $4,374 | $87,750 | $20,370 | $67,380 |
| 2020 | $4,116 | $75,330 | $18,100 | $57,230 |
| 2019 | $3,936 | $75,330 | $18,100 | $57,230 |
| 2018 | $3,956 | $75,330 | $18,100 | $57,230 |
| 2017 | $4,035 | $73,120 | $16,940 | $56,180 |
| 2016 | $4,062 | $73,120 | $16,940 | $56,180 |
| 2015 | $4,112 | $73,120 | $16,940 | $56,180 |
| 2014 | $1,886 | $66,080 | $15,330 | $50,750 |
| 2013 | $1,912 | $66,080 | $15,330 | $50,750 |
Source: Public Records
Map
Nearby Homes
- 3591 Harris Ave NW
- 3432 Stillwater Ave NW
- 3490 Cardiff Ave NW
- 6487 - 6523 Hills And Dales Rd NW
- 3436 Cardiff Ave NW
- 3452 Joyce Ave NW
- 3633 Barrington Place NW
- 3662 Marys Way Ave NW
- 3430 Joyce Ave NW
- 3533 Joyce Ave NW
- 3517 Joyce Ave NW
- 3545 Joyce Ave NW
- 3579 Joyce Ave NW
- 3451 Joyce Ave NW
- 3477 Joyce Ave NW
- 3501 Joyce Ave NW
- Lot 33 Joyce Ave NW
- 3485 Joyce Ave NW
- Lot 38 Joyce Ave NW
- 2172 Via Luna Cir NE Unit 16
- 6735 Thicket St NW
- 6773 Thicket St NW
- 6717 Thicket St NW
- 3614 White Tail Ave NW
- 6738 Thicket St NW
- 6799 Thicket St NW
- 6699 Thicket St NW
- 6720 Thicket St NW
- 3592 White Tail Ave NW
- 6806 Thicket St NW
- 6817 Thicket St NW
- 3578 White Tail Ave NW
- 6681 Thicket St NW
- 6797 Red Deer Cir NW
- 6680 Thicket St NW
- 6835 Thicket St NW
- 6830 Thicket St NW
- 6784 Red Deer Cir NW
- 6817 Red Deer Cir NW
- 6663 Thicket St NW