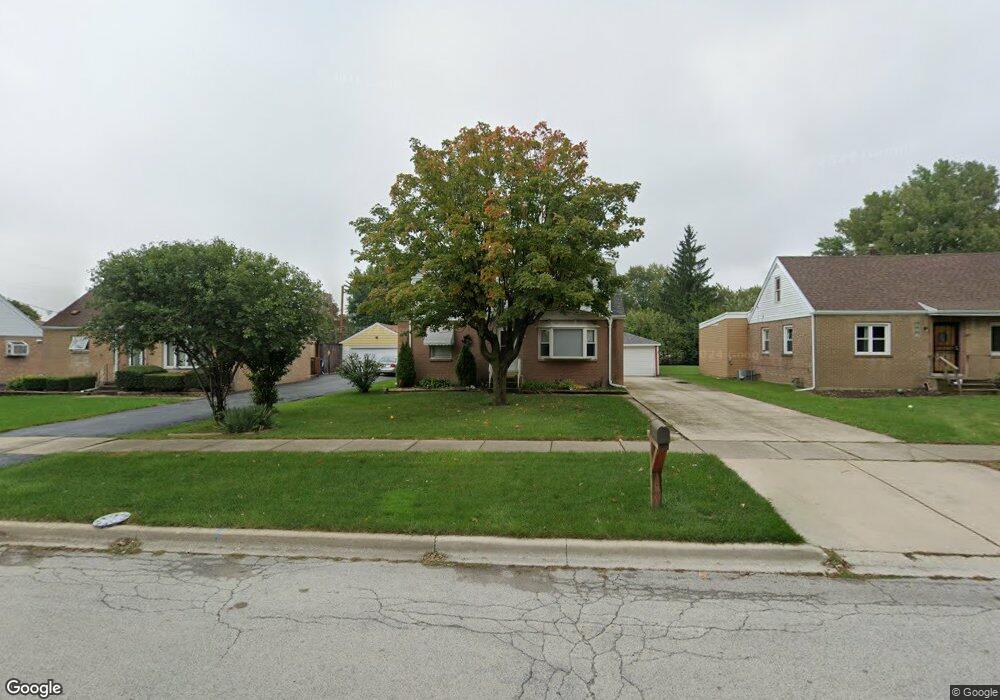
6755 S 78th Ave Bridgeview, IL 60455
Estimated Value: $282,000 - $334,000
4
Beds
2
Baths
1,818
Sq Ft
$166/Sq Ft
Est. Value
About This Home
This home is located at 6755 S 78th Ave, Bridgeview, IL 60455 and is currently estimated at $302,595, approximately $166 per square foot. 6755 S 78th Ave is a home located in Cook County with nearby schools including W.W. Walker Elementary School, Dr Donald Wharton Elementary School, and Walsh Elementary School.
Ownership History
Date
Name
Owned For
Owner Type
Purchase Details
Closed on
Nov 11, 2016
Sold by
Bylina Michael E
Bought by
Bylina Michael E and The Michael E Bylina Real Estate Trust
Current Estimated Value
Purchase Details
Closed on
Dec 12, 2011
Sold by
Secretary Of Housing & Urban Development
Bought by
Bylina Michael E
Home Financials for this Owner
Home Financials are based on the most recent Mortgage that was taken out on this home.
Original Mortgage
$65,771
Outstanding Balance
$45,553
Interest Rate
4.5%
Mortgage Type
FHA
Estimated Equity
$257,042
Purchase Details
Closed on
Mar 26, 2011
Sold by
Inclan Raul
Bought by
The Secretary Of Housing & Urban Develop
Purchase Details
Closed on
May 5, 2004
Sold by
Tessmer Russell J and Tessmer Gail E
Bought by
Inclan Raul and Inclan Ana M
Home Financials for this Owner
Home Financials are based on the most recent Mortgage that was taken out on this home.
Original Mortgage
$203,761
Interest Rate
5.91%
Mortgage Type
FHA
Create a Home Valuation Report for This Property
The Home Valuation Report is an in-depth analysis detailing your home's value as well as a comparison with similar homes in the area
Home Values in the Area
Average Home Value in this Area
Purchase History
| Date | Buyer | Sale Price | Title Company |
|---|---|---|---|
| Bylina Michael E | -- | None Available | |
| Bylina Michael E | -- | Pntn | |
| The Secretary Of Housing & Urban Develop | -- | None Available | |
| Inclan Raul | $207,000 | Pntn |
Source: Public Records
Mortgage History
| Date | Status | Borrower | Loan Amount |
|---|---|---|---|
| Open | Bylina Michael E | $65,771 | |
| Previous Owner | Inclan Raul | $203,761 |
Source: Public Records
Tax History
| Year | Tax Paid | Tax Assessment Tax Assessment Total Assessment is a certain percentage of the fair market value that is determined by local assessors to be the total taxable value of land and additions on the property. | Land | Improvement |
|---|---|---|---|---|
| 2025 | $7,089 | $20,033 | $4,509 | $15,524 |
| 2024 | $7,089 | $20,033 | $4,509 | $15,524 |
| 2023 | $6,275 | $22,000 | $4,509 | $17,491 |
| 2022 | $6,275 | $17,216 | $4,008 | $13,208 |
| 2021 | $6,052 | $17,215 | $4,008 | $13,207 |
| 2020 | $6,204 | $17,215 | $4,008 | $13,207 |
| 2019 | $4,903 | $13,564 | $3,757 | $9,807 |
| 2018 | $4,712 | $13,564 | $3,757 | $9,807 |
| 2017 | $4,654 | $13,564 | $3,757 | $9,807 |
| 2016 | $4,783 | $12,418 | $3,256 | $9,162 |
| 2015 | $4,463 | $12,418 | $3,256 | $9,162 |
| 2014 | $4,384 | $12,418 | $3,256 | $9,162 |
| 2013 | $5,183 | $15,855 | $3,256 | $12,599 |
Source: Public Records
Map
Nearby Homes
- 6807 S 79th Ave
- 7705 Columbia Dr
- 7851 Suburban Ln
- 7824 W 66th Place
- 7710 66th St
- 7702 W 66th St
- 6918 Garden Ln
- 7813 W 65th Place
- 7214 S 78th Ave
- 7502 64th St
- 7421 W 64th St
- 7420 W 63rd Place
- 7912 W 73rd St
- 7838 W 73rd Place
- 7524 W 63rd Place
- 7235 W 71st St Unit 7235-4
- 7332 Beloit Ave
- 7945 W 73rd Place
- 7957 W 73rd Place
- 7216 S Octavia Ave
- 6801 S 78th Ave
- 6749 S 78th Ave
- 6743 S 78th Ave
- 6807 S 78th Ave
- 6754 Maple Ct
- 6800 Maple Ct Unit 2
- 6813 S 78th Ave
- 6748 Maple Ct
- 6806 Maple Ct
- 7741 Suburban Ln
- 7749 Suburban Ln
- 7737 Suburban Ln
- 6754 S 78th Ave
- 6800 S 78th Ave
- 6748 S 78th Ave
- 6819 S 78th Ave
- 6812 Maple Ct
- 6806 S 78th Ave
- 6742 S 78th Ave
- 7801 Suburban Ln
Your Personal Tour Guide
Ask me questions while you tour the home.