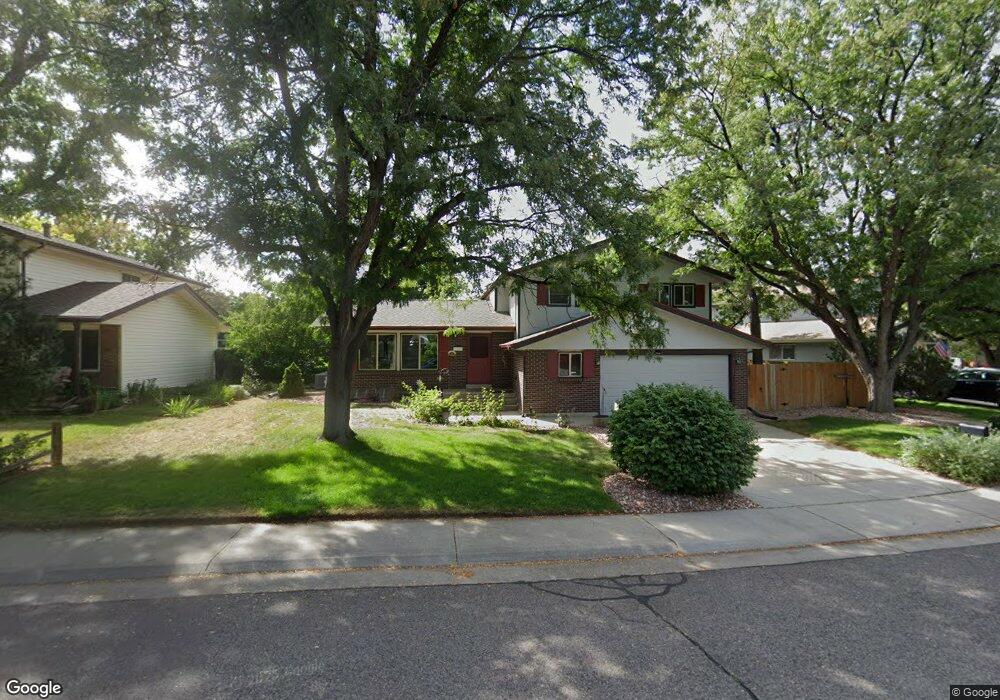
6757 Xenon Dr Arvada, CO 80004
Northwest Arvada NeighborhoodEstimated Value: $629,665 - $713,000
3
Beds
3
Baths
1,835
Sq Ft
$363/Sq Ft
Est. Value
About This Home
This home is located at 6757 Xenon Dr, Arvada, CO 80004 and is currently estimated at $666,166, approximately $363 per square foot. 6757 Xenon Dr is a home located in Jefferson County with nearby schools including Stott Elementary School, Oberon Middle School, and Arvada West High School.
Ownership History
Date
Name
Owned For
Owner Type
Purchase Details
Closed on
Jul 25, 2014
Sold by
Ellison Kathy
Bought by
Ellison Kathy
Current Estimated Value
Home Financials for this Owner
Home Financials are based on the most recent Mortgage that was taken out on this home.
Original Mortgage
$100,000
Outstanding Balance
$76,062
Interest Rate
4.2%
Mortgage Type
Credit Line Revolving
Estimated Equity
$590,104
Purchase Details
Closed on
Apr 29, 2008
Sold by
Klitsner Irving N and Klitsner Muriel F
Bought by
Ellison Kathy and Klitsner Irving N
Purchase Details
Closed on
Sep 25, 2007
Sold by
Ostwald Donna Duvall and Ostwald Donald Alexander
Bought by
Klitsner Irving N and Klitsner Muriel F
Home Financials for this Owner
Home Financials are based on the most recent Mortgage that was taken out on this home.
Original Mortgage
$188,000
Outstanding Balance
$118,361
Interest Rate
6.55%
Mortgage Type
Purchase Money Mortgage
Estimated Equity
$547,805
Create a Home Valuation Report for This Property
The Home Valuation Report is an in-depth analysis detailing your home's value as well as a comparison with similar homes in the area
Home Values in the Area
Average Home Value in this Area
Purchase History
| Date | Buyer | Sale Price | Title Company |
|---|---|---|---|
| Ellison Kathy | -- | Dri Title & Escrow | |
| Ellison Kathy | -- | None Available | |
| Klitsner Irving N | $268,000 | Guardian Title |
Source: Public Records
Mortgage History
| Date | Status | Borrower | Loan Amount |
|---|---|---|---|
| Open | Ellison Kathy | $100,000 | |
| Open | Klitsner Irving N | $188,000 |
Source: Public Records
Tax History Compared to Growth
Tax History
| Year | Tax Paid | Tax Assessment Tax Assessment Total Assessment is a certain percentage of the fair market value that is determined by local assessors to be the total taxable value of land and additions on the property. | Land | Improvement |
|---|---|---|---|---|
| 2024 | $2,902 | $36,615 | $14,040 | $22,575 |
| 2023 | $2,902 | $36,615 | $14,040 | $22,575 |
| 2022 | $2,106 | $28,457 | $11,470 | $16,987 |
| 2021 | $2,141 | $29,276 | $11,800 | $17,476 |
| 2020 | $2,027 | $28,153 | $10,633 | $17,520 |
| 2019 | $2,680 | $28,153 | $10,633 | $17,520 |
| 2018 | $2,440 | $24,923 | $5,796 | $19,127 |
| 2017 | $2,234 | $24,923 | $5,796 | $19,127 |
| 2016 | $2,151 | $22,609 | $5,527 | $17,082 |
| 2015 | $1,990 | $22,609 | $5,527 | $17,082 |
| 2014 | $1,990 | $19,651 | $4,384 | $15,267 |
Source: Public Records
Map
Nearby Homes
- 6616 Zang Cir
- 6762 Beech Dr
- 6440 Wright St
- 12924 W 64th Dr Unit B
- 6416 Zang Ct
- 13432 W 65th Place
- 13553 W 65th Place
- 7049 Van Gordon Ct
- 13155 W 63rd Place
- 13755 W 65th Dr
- 13304 W 70th Place
- 6537 Coors St
- 7154 Welch Ct
- 13245 W 63rd Cir
- 7004 Beech Ct
- 11925 W 66th Place Unit B
- 11820 W 66th Place Unit A
- 13812 W 64th Place
- 13168 W 62nd Dr
- 12871 W 74th Dr
- 6747 Xenon Dr
- 6763 Xenon Dr
- 6715 Youngfield Ct
- 6725 Youngfield Ct
- 6767 Xenon Dr
- 6743 Xenon Dr
- 12809 W 68th Ave
- 12808 W 68th Ave
- 6735 Youngfield Ct
- 6762 Xenon Dr
- 6773 Xenon Dr
- 6737 Xenon Dr
- 12790 W 67th Way
- 12818 W 68th Ave
- 12839 W 68th Ave
- 12780 W 67th Way
- 6755 Youngfield Ct
- 6764 Xenon Dr
- 6745 Youngfield Ct
- 6777 Xenon Dr