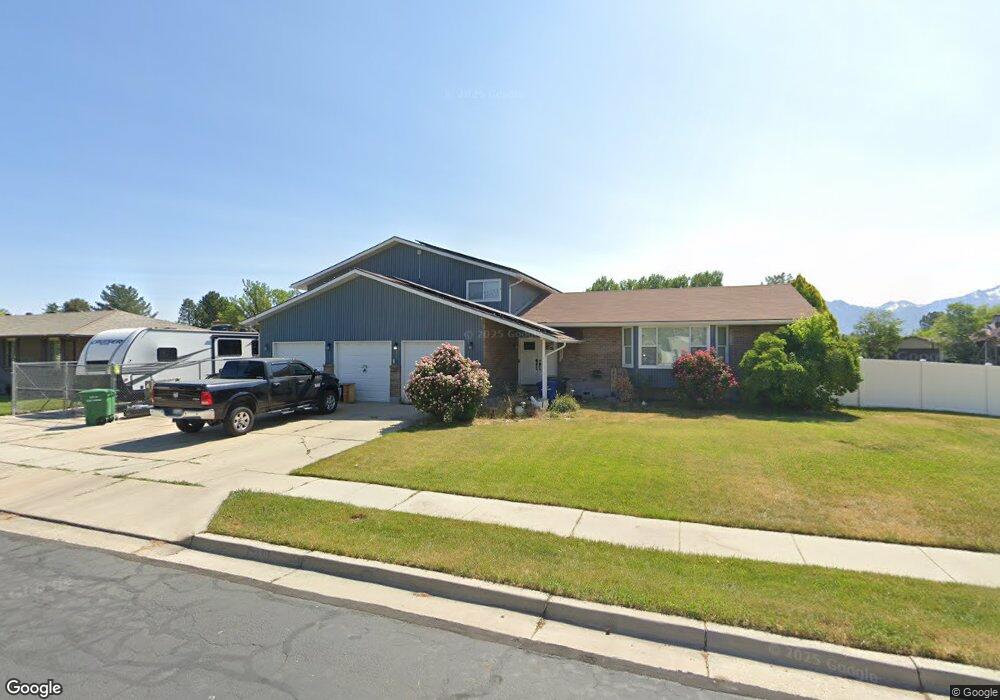
6759 Larabrook Way West Jordan, UT 84084
Estimated Value: $712,000 - $743,000
5
Beds
4
Baths
2,826
Sq Ft
$256/Sq Ft
Est. Value
About This Home
This home is located at 6759 Larabrook Way, West Jordan, UT 84084 and is currently estimated at $724,107, approximately $256 per square foot. 6759 Larabrook Way is a home located in Salt Lake County with nearby schools including West Jordan Middle School, West Jordan High School, and Learning Tree School - Southwest.
Ownership History
Date
Name
Owned For
Owner Type
Purchase Details
Closed on
Aug 12, 2020
Sold by
Weakland James and Weakland Patricia B
Bought by
Weakland James and Weakland Patricia B
Current Estimated Value
Home Financials for this Owner
Home Financials are based on the most recent Mortgage that was taken out on this home.
Original Mortgage
$439,698
Outstanding Balance
$390,043
Interest Rate
3%
Mortgage Type
VA
Estimated Equity
$334,064
Purchase Details
Closed on
Sep 27, 2018
Sold by
Weakland James
Bought by
Weakland James and Weakland Patricia B
Home Financials for this Owner
Home Financials are based on the most recent Mortgage that was taken out on this home.
Original Mortgage
$426,332
Interest Rate
4.5%
Mortgage Type
VA
Purchase Details
Closed on
Mar 29, 2018
Sold by
Ketter David E and The Peter M Brave Trystq
Bought by
Broadwest Equity Llc
Create a Home Valuation Report for This Property
The Home Valuation Report is an in-depth analysis detailing your home's value as well as a comparison with similar homes in the area
Home Values in the Area
Average Home Value in this Area
Purchase History
| Date | Buyer | Sale Price | Title Company |
|---|---|---|---|
| Weakland James | -- | None Available | |
| Weakland James | -- | None Available | |
| Weakland James | -- | Vanguard Title | |
| Weakland James | -- | Stewart Title Ins Agcy Of Ut | |
| Broadwest Equity Llc | -- | Cottonwood Title |
Source: Public Records
Mortgage History
| Date | Status | Borrower | Loan Amount |
|---|---|---|---|
| Open | Weakland James | $439,698 | |
| Closed | Weakland James | $426,332 |
Source: Public Records
Tax History Compared to Growth
Tax History
| Year | Tax Paid | Tax Assessment Tax Assessment Total Assessment is a certain percentage of the fair market value that is determined by local assessors to be the total taxable value of land and additions on the property. | Land | Improvement |
|---|---|---|---|---|
| 2025 | $3,531 | $700,300 | $124,600 | $575,700 |
| 2024 | $3,531 | $679,400 | $120,400 | $559,000 |
| 2023 | $3,568 | $647,000 | $115,800 | $531,200 |
| 2022 | $3,713 | $662,400 | $113,500 | $548,900 |
| 2021 | $3,131 | $508,400 | $89,800 | $418,600 |
| 2020 | $2,915 | $444,200 | $83,900 | $360,300 |
| 2019 | $2,960 | $443,300 | $83,900 | $359,400 |
| 2018 | $0 | $333,200 | $79,300 | $253,900 |
| 2017 | $2,090 | $308,500 | $79,300 | $229,200 |
| 2016 | $2,027 | $281,000 | $79,300 | $201,700 |
| 2015 | $1,746 | $236,000 | $81,400 | $154,600 |
| 2014 | $1,651 | $219,700 | $77,600 | $142,100 |
Source: Public Records
Map
Nearby Homes
- 6893 S 3200 W
- 6672 S 3335 W
- 6512 Timpanogos Way
- 8524 S Michele River Ave W Unit 109
- 3383 W 6880 S
- 6453 Fremont Peak Cir
- 2683 W Carson Ln
- 3226 Tysonbrook Ct
- 6918 S Harvest Cir
- 3052 W Matterhorn Dr
- 3305 W Kingsbrook Ave
- 6482 S Gold Medal Dr
- 6968 S 3535 W Unit 3
- 6980 S 3535 W Unit 2
- 6863 S Dixie Dr
- 3538 W Biathlon Cir
- 3537 W Green Springs Ln
- 2421 W 6900 S
- 1824 W 6200 S
- 3660 Ashland Cir
- 6759 S Larabrook Way
- 3072 Mandy Cir
- 6745 Larabrook Way
- 3075 Willette Cir
- 6754 Larabrook Way
- 6768 Larabrook Way
- 6781 Larabrook Way
- 6742 Larabrook Way
- 3061 W Willette Cir
- 3061 Willette Cir
- 3071 Mandy Cir
- 3062 Mandy Cir
- 6780 Larabrook Way
- 3061 Mandy Cir
- 6755 Baldwin Ave
- 6755 S 3150 W
- 6749 Baldwin Ave
- 6769 S 3150 W
- 6795 Larabrook Way
- 3049 Willette Cir