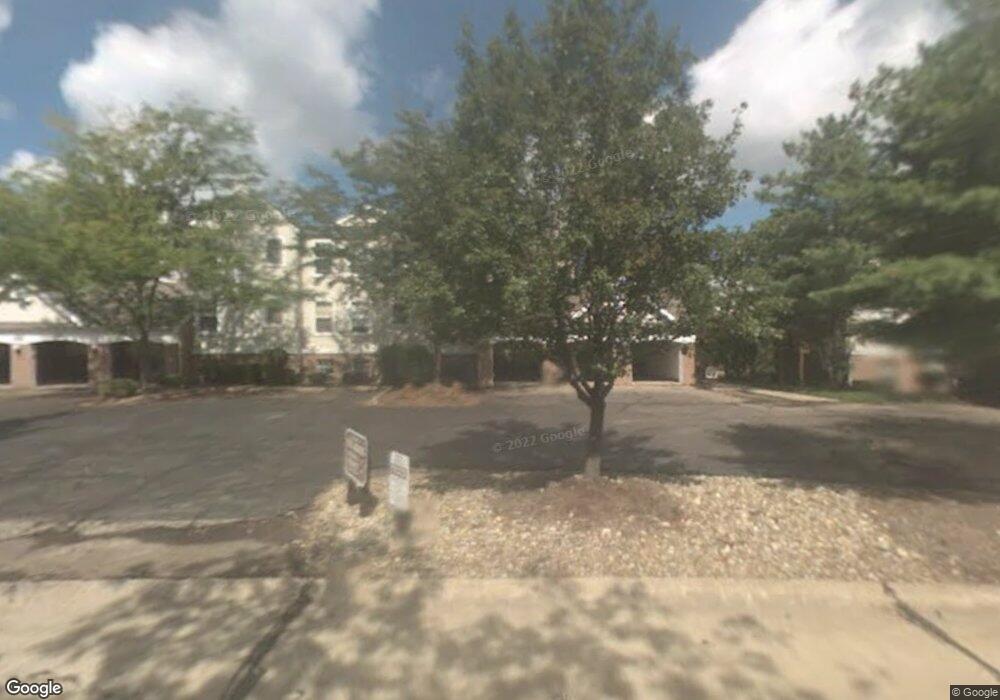
676 Brick Mill Run Westlake, OH 44145
Estimated Value: $183,000 - $215,000
2
Beds
2
Baths
1,098
Sq Ft
$177/Sq Ft
Est. Value
About This Home
This home is located at 676 Brick Mill Run, Westlake, OH 44145 and is currently estimated at $194,120, approximately $176 per square foot. 676 Brick Mill Run is a home located in Cuyahoga County with nearby schools including Westlake Elementary School, Dover Intermediate School, and Lee Burneson Middle School.
Ownership History
Date
Name
Owned For
Owner Type
Purchase Details
Closed on
Sep 30, 2009
Sold by
Sheehan Thomas R and Sheehan Susan V
Bought by
Sheehan William N
Current Estimated Value
Home Financials for this Owner
Home Financials are based on the most recent Mortgage that was taken out on this home.
Original Mortgage
$96,750
Outstanding Balance
$63,530
Interest Rate
5.19%
Mortgage Type
New Conventional
Estimated Equity
$130,590
Purchase Details
Closed on
May 30, 2006
Sold by
Cagle Gerald S and Cagle Patricia K
Bought by
Sheehan Thomas R and Sheehan Susan
Home Financials for this Owner
Home Financials are based on the most recent Mortgage that was taken out on this home.
Original Mortgage
$71,000
Interest Rate
6.62%
Mortgage Type
Fannie Mae Freddie Mac
Purchase Details
Closed on
Jan 1, 1992
Bought by
Cagle Gerald S and P K
Create a Home Valuation Report for This Property
The Home Valuation Report is an in-depth analysis detailing your home's value as well as a comparison with similar homes in the area
Home Values in the Area
Average Home Value in this Area
Purchase History
| Date | Buyer | Sale Price | Title Company |
|---|---|---|---|
| Sheehan William N | $107,500 | Cleveland Home Title | |
| Sheehan Thomas R | $121,000 | Real Living Title Agency L | |
| Cagle Gerald S | -- | -- |
Source: Public Records
Mortgage History
| Date | Status | Borrower | Loan Amount |
|---|---|---|---|
| Open | Sheehan William N | $96,750 | |
| Previous Owner | Sheehan Thomas R | $71,000 |
Source: Public Records
Tax History Compared to Growth
Tax History
| Year | Tax Paid | Tax Assessment Tax Assessment Total Assessment is a certain percentage of the fair market value that is determined by local assessors to be the total taxable value of land and additions on the property. | Land | Improvement |
|---|---|---|---|---|
| 2024 | $2,617 | $54,810 | $5,495 | $49,315 |
| 2023 | $2,240 | $40,430 | $4,060 | $36,370 |
| 2022 | $2,204 | $40,430 | $4,060 | $36,370 |
| 2021 | $2,207 | $40,430 | $4,060 | $36,370 |
| 2020 | $1,706 | $28,670 | $2,870 | $25,800 |
| 2019 | $1,654 | $81,900 | $8,200 | $73,700 |
| 2018 | $1,548 | $28,670 | $2,870 | $25,800 |
| 2017 | $1,450 | $23,530 | $3,610 | $19,920 |
| 2016 | $1,442 | $23,530 | $3,610 | $19,920 |
| 2015 | $1,749 | $23,530 | $3,610 | $19,920 |
| 2014 | $1,749 | $28,010 | $4,310 | $23,700 |
Source: Public Records
Map
Nearby Homes
- 700 Brick Mill Run Unit 406
- 22576 Peach Tree Ln
- 851 Brick Mill Run Unit 10
- 7 Pond Dr
- 22722 Lake Rd
- 22728 Lake Rd
- 22700 Lake Rd Unit 204
- 22700 Lake Rd Unit 305
- 22700 Lake Rd Unit 406
- 22700 Lake Rd Unit 306
- 22700 Lake Rd Unit 405
- 22700 Lake Rd Unit 304
- 22700 Lake Rd Unit 504
- 22700 Lake Rd Unit 102
- 23200 Lake Rd Unit 50
- 23200 Lake Rd Unit 47
- 23200 Lake Rd Unit 30
- 22500 Lake Rd Unit 202
- 22480 Lake Rd Unit 9
- 1330 E Melrose Dr
- 684 Brick Mill Run Unit C3
- 688 Brick Mill Run
- 678 Brick Mill Run Unit B2
- 696 Brick Mill Run Unit D3
- 692 Brick Mill Run
- 680 Brick Mill Run
- 686 Brick Mill Run
- 686 Brick Mill Run Unit A-1
- 676 Brick Mill Run Unit C1
- 680 Brick Mill Run Unit C2
- 688 Brick Mill Run Unit D-1
- 682 Brick Mill Run Unit B3
- 23059 Brick Mill Run Unit B2
- 23051 Brick Mill Run Unit A3
- 23055 Brick Mill Run
- 23053 Brick Mill Run Unit C1
- 23023 Brick Mill Run
- 23047 Brick Mill Run
- 23019 Brick Mill Run
- 23007 Brick Mill Run