Estimated Value: $347,000 - $387,000
4
Beds
1
Bath
1,660
Sq Ft
$220/Sq Ft
Est. Value
About This Home
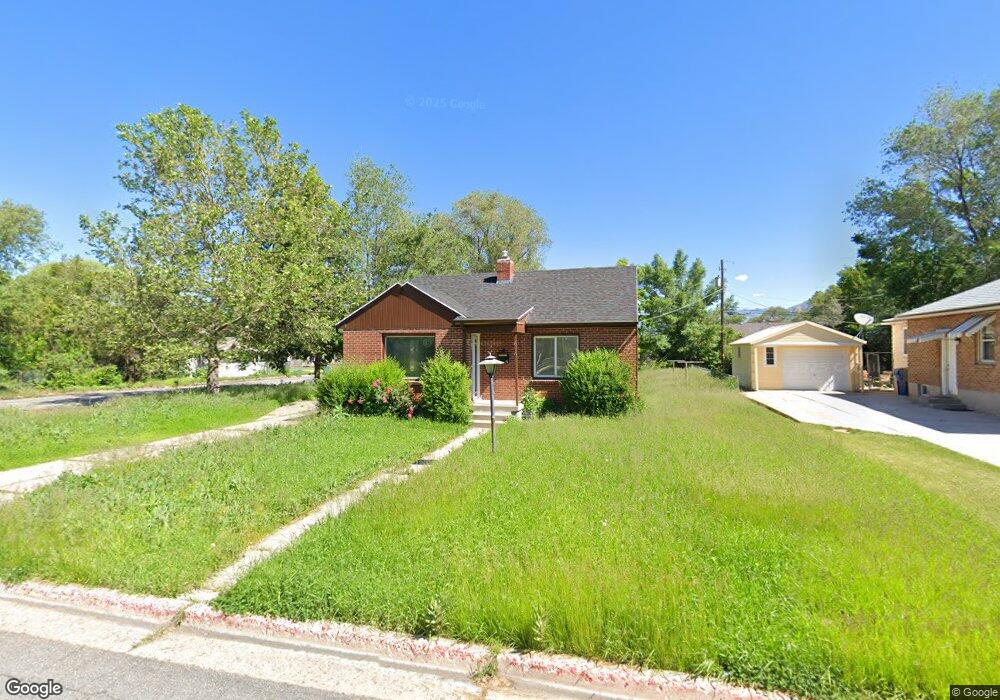
This home is located at 676 Maple St, Ogden, UT 84403 and is currently estimated at $365,657, approximately $220 per square foot. 676 Maple St is a home located in Weber County with nearby schools including Burch Creek School, South Ogden Junior High School, and Bonneville High School.
Ownership History
Date
Name
Owned For
Owner Type
Purchase Details
Closed on
Jun 4, 2019
Sold by
Canyon Advantage Llc
Bought by
Roberts Shad and Roberts Jenna L
Current Estimated Value
Home Financials for this Owner
Home Financials are based on the most recent Mortgage that was taken out on this home.
Original Mortgage
$225,150
Outstanding Balance
$196,307
Interest Rate
4.1%
Mortgage Type
New Conventional
Estimated Equity
$169,350
Purchase Details
Closed on
Dec 28, 2018
Sold by
Sutton Joseph and Sutton Victoria
Bought by
Canyon Advantage Llc
Purchase Details
Closed on
Sep 28, 2006
Sold by
Larson David C and Marcus Heidi
Bought by
Sutton Joseph and Sutton Victoria
Home Financials for this Owner
Home Financials are based on the most recent Mortgage that was taken out on this home.
Original Mortgage
$110,314
Interest Rate
6.53%
Mortgage Type
FHA
Purchase Details
Closed on
Mar 12, 2003
Sold by
Butters Nancy M
Bought by
Butters Karl T
Purchase Details
Closed on
Apr 29, 2002
Sold by
Butters Karl T
Bought by
Butters Karl T
Create a Home Valuation Report for This Property
The Home Valuation Report is an in-depth analysis detailing your home's value as well as a comparison with similar homes in the area
Home Values in the Area
Average Home Value in this Area
Purchase History
| Date | Buyer | Sale Price | Title Company |
|---|---|---|---|
| Roberts Shad | -- | Title Guarantee Rivers Park | |
| Canyon Advantage Llc | $133,211 | Etitle Insurance Agency | |
| Sutton Joseph | -- | Bonneville Superior Title Co | |
| Butters Karl T | -- | First American Title | |
| Butters Karl T | -- | First American Title |
Source: Public Records
Mortgage History
| Date | Status | Borrower | Loan Amount |
|---|---|---|---|
| Open | Roberts Shad | $225,150 | |
| Previous Owner | Sutton Joseph | $110,314 |
Source: Public Records
Tax History
| Year | Tax Paid | Tax Assessment Tax Assessment Total Assessment is a certain percentage of the fair market value that is determined by local assessors to be the total taxable value of land and additions on the property. | Land | Improvement |
|---|---|---|---|---|
| 2025 | $2,467 | $336,599 | $111,877 | $224,722 |
| 2024 | $2,361 | $180,949 | $61,532 | $119,417 |
| 2023 | $2,302 | $177,650 | $59,951 | $117,699 |
| 2022 | $2,164 | $171,600 | $51,654 | $119,946 |
| 2021 | $1,838 | $242,000 | $57,358 | $184,642 |
| 2020 | $1,636 | $198,000 | $47,895 | $150,105 |
| 2019 | $1,524 | $173,999 | $37,777 | $136,222 |
| 2018 | $1,392 | $149,000 | $37,777 | $111,223 |
| 2017 | $1,245 | $125,000 | $32,682 | $92,318 |
| 2016 | $1,097 | $59,838 | $17,462 | $42,376 |
| 2015 | $1,111 | $59,838 | $17,462 | $42,376 |
| 2014 | $950 | $48,630 | $17,462 | $31,168 |
Source: Public Records
Map
Nearby Homes
- 668 37th St
- 3760 Jefferson Ave
- 3624 Porter Ave
- 3675 Porter Ave
- 3845 Nordin Ave
- 612 35th St
- 3874 Orchard Ave
- 3596 Adams Ave
- 3813 Grandview Dr
- 3538 Adams Ave
- 3683 Adams Ave
- 3567 Adams Ave
- 3555 Adams Ave
- 835 Franklin St
- 848 Franklin St
- 3828 Quincy Ave
- 428 37th St
- 3868 Grandview Dr
- 3445 Adams Ave
- 755 Boughton St
- 698 Maple St
- 677 36th St
- 712 Maple St
- 695 36th St
- 709 36th St
- 675 Maple St
- 728 Maple St
- 3620 Orchard Ave
- 697 Maple St
- 3644 Orchard Ave
- 3610 Orchard Ave
- 3646 Orchard Ave
- 711 Maple St
- 3608 Orchard Ave Unit 3608 Orchard Avenue
- 3608 Orchard Ave Unit 3608 Orchard 1
- 3608 Orchard Ave
- 721 36th St
- 3650 Orchard Ave
- 736 Maple St
- 725 Maple St
Your Personal Tour Guide
Ask me questions while you tour the home.