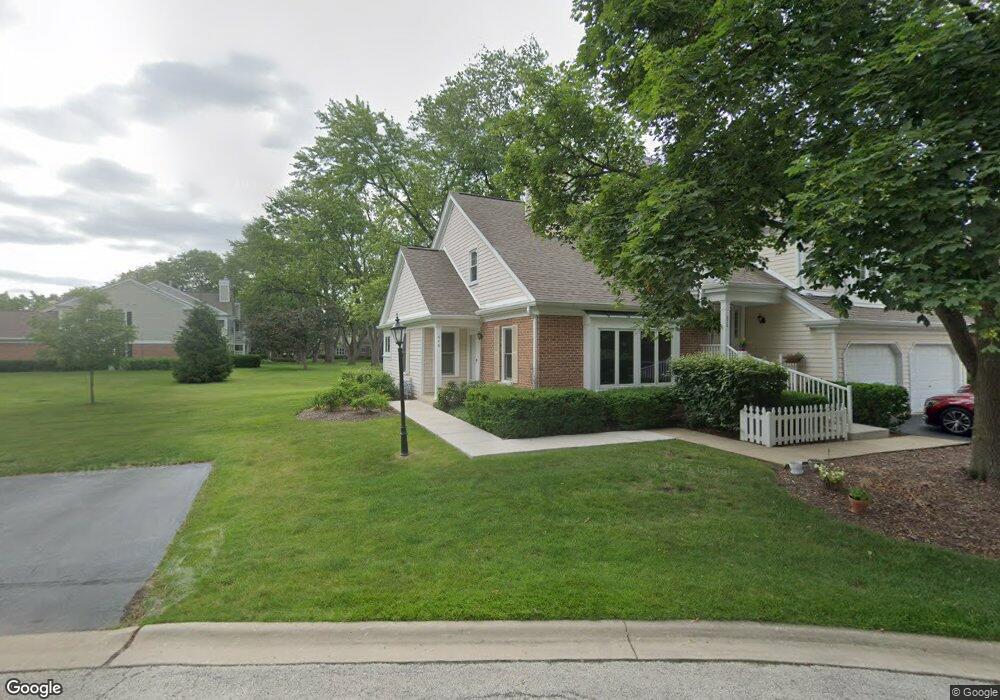
676 Regent Ln Unit 11586 Prospect Heights, IL 60070
Estimated Value: $329,982 - $410,000
2
Beds
--
Bath
1,465
Sq Ft
$252/Sq Ft
Est. Value
About This Home
This home is located at 676 Regent Ln Unit 11586, Prospect Heights, IL 60070 and is currently estimated at $368,496, approximately $251 per square foot. 676 Regent Ln Unit 11586 is a home located in Cook County with nearby schools including Euclid Elementary School, River Trails Middle School, and John Hersey High School.
Create a Home Valuation Report for This Property
The Home Valuation Report is an in-depth analysis detailing your home's value as well as a comparison with similar homes in the area
Home Values in the Area
Average Home Value in this Area
Tax History Compared to Growth
Tax History
| Year | Tax Paid | Tax Assessment Tax Assessment Total Assessment is a certain percentage of the fair market value that is determined by local assessors to be the total taxable value of land and additions on the property. | Land | Improvement |
|---|---|---|---|---|
| 2024 | $5,570 | $23,423 | $2,109 | $21,314 |
| 2023 | $5,170 | $23,423 | $2,109 | $21,314 |
| 2022 | $5,170 | $23,423 | $2,109 | $21,314 |
| 2021 | $4,622 | $19,384 | $659 | $18,725 |
| 2020 | $4,575 | $19,384 | $659 | $18,725 |
| 2019 | $4,622 | $21,715 | $659 | $21,056 |
| 2018 | $3,932 | $18,157 | $527 | $17,630 |
| 2017 | $3,913 | $18,157 | $527 | $17,630 |
| 2016 | $4,194 | $18,157 | $527 | $17,630 |
| 2015 | $3,722 | $15,828 | $1,054 | $14,774 |
| 2014 | $5,142 | $15,828 | $1,054 | $14,774 |
| 2013 | $3,590 | $15,828 | $1,054 | $14,774 |
Source: Public Records
Map
Nearby Homes
- 212 Country Club Dr Unit 198
- 688 Glasgow Ln Unit 121133
- 763 Sussex Corner Ln Unit 15
- 603 Thistle Ln Unit 16185
- 501 Aberdeen Ln Unit C
- 354 Country Club Dr
- 1214 N Crabtree Ln
- 302 Lonsdale Rd
- 1121 N Greenfield Ln
- 1116 N Westgate Rd
- 203 Coldren Dr
- 703 Newcastle Ln
- 206 E Camp Mcdonald Rd
- 1000 N Westgate Rd
- 1008 N Newberry Ln
- 1142 N Boxwood Dr Unit B
- 1205 E Camp Mcdonald Rd
- 1120 N Boxwood Dr Unit B
- 300 E Marion Ave
- 1622 E Greenwood Dr
- 678 Regent Ln Unit 11586
- 680 Regent Ln Unit 11586L
- 682 Regent Ln Unit 11586L
- 684 Regent Ln
- 686 Regent Ln Unit 11586
- 686 Regent Ln
- 222 Country Club Dr Unit 198
- 673 Regent Ln Unit 11383
- 673 Regent Ln Unit C
- 675 Regent Ln Unit D
- 677 Regent Ln Unit 11383
- 668 Regent Ln Unit A
- 668 Regent Ln Unit 11785
- 668 Regent Ln Unit 11785
- 668 Regent Ln Unit 11785
- 668 Regent Ln Unit C
- 668 Regent Ln Unit B
- 668 Regent Ln Unit D
- 679 Regent Ln Unit 11383
- 220 Country Club Dr Unit 198