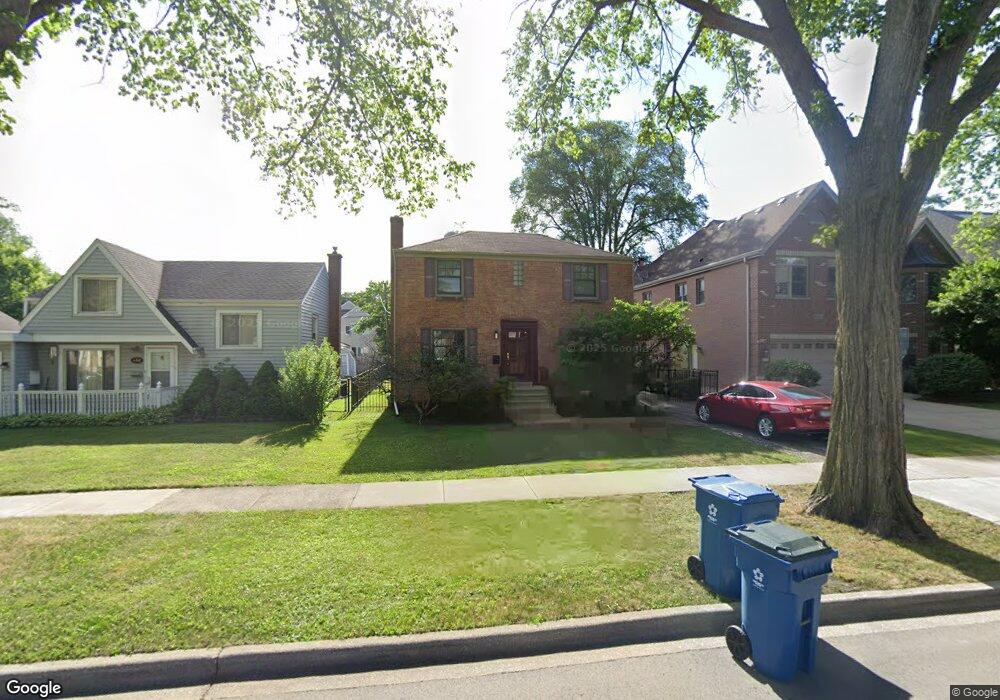
676 S Bryan St Elmhurst, IL 60126
Estimated Value: $600,000 - $667,000
3
Beds
3
Baths
1,560
Sq Ft
$404/Sq Ft
Est. Value
About This Home
This home is located at 676 S Bryan St, Elmhurst, IL 60126 and is currently estimated at $630,911, approximately $404 per square foot. 676 S Bryan St is a home located in DuPage County with nearby schools including Pulaski Intl School of Chicago, Lincoln Elementary School, and Bryan Middle School.
Ownership History
Date
Name
Owned For
Owner Type
Purchase Details
Closed on
Aug 6, 2007
Sold by
Wake Kenneth R
Bought by
Polowsky Robert P and Polowsky Beverly A
Current Estimated Value
Home Financials for this Owner
Home Financials are based on the most recent Mortgage that was taken out on this home.
Original Mortgage
$404,000
Outstanding Balance
$256,446
Interest Rate
6.71%
Mortgage Type
Purchase Money Mortgage
Estimated Equity
$374,465
Purchase Details
Closed on
Dec 6, 2005
Sold by
Wake Jennifer L
Bought by
Wake Kenneth R
Purchase Details
Closed on
Sep 11, 2003
Sold by
Fowler Gary L and Fowler Barbara C
Bought by
Gary L & Barbara C Fowler Revocable Tr
Purchase Details
Closed on
Jun 23, 2003
Sold by
Fowler Gary L and Fowler Barbara C
Bought by
Wake Kenneth R and Wake Jennifer L
Home Financials for this Owner
Home Financials are based on the most recent Mortgage that was taken out on this home.
Original Mortgage
$287,200
Interest Rate
5.4%
Mortgage Type
Balloon
Create a Home Valuation Report for This Property
The Home Valuation Report is an in-depth analysis detailing your home's value as well as a comparison with similar homes in the area
Home Values in the Area
Average Home Value in this Area
Purchase History
| Date | Buyer | Sale Price | Title Company |
|---|---|---|---|
| Polowsky Robert P | $505,000 | Chicago Title Insurance Co | |
| Wake Kenneth R | -- | -- | |
| Gary L & Barbara C Fowler Revocable Tr | -- | None Available | |
| Wake Kenneth R | $359,000 | Ctic |
Source: Public Records
Mortgage History
| Date | Status | Borrower | Loan Amount |
|---|---|---|---|
| Open | Polowsky Robert P | $404,000 | |
| Previous Owner | Wake Kenneth R | $287,200 |
Source: Public Records
Tax History Compared to Growth
Tax History
| Year | Tax Paid | Tax Assessment Tax Assessment Total Assessment is a certain percentage of the fair market value that is determined by local assessors to be the total taxable value of land and additions on the property. | Land | Improvement |
|---|---|---|---|---|
| 2024 | $10,294 | $178,809 | $75,741 | $103,068 |
| 2023 | $9,553 | $165,350 | $70,040 | $95,310 |
| 2022 | $9,275 | $158,950 | $67,330 | $91,620 |
| 2021 | $9,044 | $155,000 | $65,660 | $89,340 |
| 2020 | $8,694 | $151,600 | $64,220 | $87,380 |
| 2019 | $8,509 | $144,140 | $61,060 | $83,080 |
| 2018 | $8,120 | $137,070 | $57,800 | $79,270 |
| 2017 | $7,940 | $130,620 | $55,080 | $75,540 |
| 2016 | $7,770 | $123,050 | $51,890 | $71,160 |
| 2015 | $7,688 | $114,630 | $48,340 | $66,290 |
| 2014 | $8,282 | $113,470 | $38,370 | $75,100 |
| 2013 | $8,193 | $115,070 | $38,910 | $76,160 |
Source: Public Records
Map
Nearby Homes
- 680 S Bryan St
- 611 S Prospect Ave
- 694 S York St
- 570 S Parkside Ave
- 618 S Swain Ave
- 762 S Saylor Ave
- 185 E Oneida Ave
- 634 S Spring Rd
- 15 Manchester Ln
- 814 S Saylor Ave
- 801 S Spring Rd
- 28 Windsor Dr
- 805 S Spring Rd
- 580 S Kearsage Ave
- 816 S Spring Rd
- 500 S Kenilworth Ave
- 663 S Hawthorne Ave
- 274 E Crescent Ave
- 613 S Chatham Ave
- 162 E Hale St
- 672 S Bryan St
- 686 S Bryan St
- 670 S Bryan St
- 688 S Bryan St
- 677 S Parkside Ave
- 673 S Parkside Ave
- 681 S Parkside Ave
- 679 S Bryan St
- 675 S Bryan St
- 685 S Parkside Ave
- 683 S Bryan St
- 687 S Bryan St
- 671 S Bryan St
- 694 S Bryan St
- 669 S Parkside Ave
- 665 S Parkside Ave
- 660 S Bryan St
- 667 S Bryan St
- 691 S Bryan St
- 698 S Bryan St