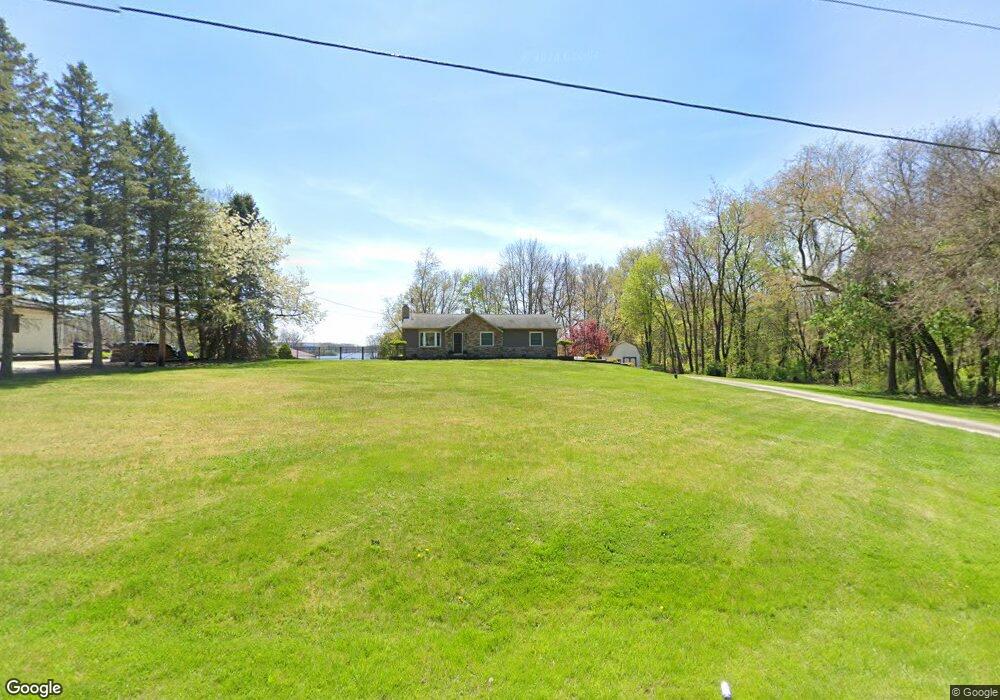
676 Waterloo Rd Mogadore, OH 44260
Estimated Value: $210,089 - $249,000
3
Beds
1
Bath
1,144
Sq Ft
$204/Sq Ft
Est. Value
About This Home
This home is located at 676 Waterloo Rd, Mogadore, OH 44260 and is currently estimated at $233,022, approximately $203 per square foot. 676 Waterloo Rd is a home located in Portage County with nearby schools including Suffield Elementary School, Field Middle School, and Field High School.
Ownership History
Date
Name
Owned For
Owner Type
Purchase Details
Closed on
Dec 8, 2011
Sold by
Ferrell Ronald J
Bought by
Ferrell Ronald and Ferrell Jessika
Current Estimated Value
Home Financials for this Owner
Home Financials are based on the most recent Mortgage that was taken out on this home.
Original Mortgage
$108,000
Outstanding Balance
$6,769
Interest Rate
3.32%
Mortgage Type
New Conventional
Estimated Equity
$226,253
Purchase Details
Closed on
Jul 15, 2004
Sold by
Kiggans Harold L and Kiggans Laura M
Bought by
Ferrell Ronald J
Home Financials for this Owner
Home Financials are based on the most recent Mortgage that was taken out on this home.
Original Mortgage
$142,500
Interest Rate
6.37%
Mortgage Type
Purchase Money Mortgage
Purchase Details
Closed on
Jan 1, 1990
Bought by
Kiggans Harold and Kiggans Maxine
Create a Home Valuation Report for This Property
The Home Valuation Report is an in-depth analysis detailing your home's value as well as a comparison with similar homes in the area
Purchase History
We collect this data history from publicly available records. To have your information removed, we recommend requesting removal directly through your county’s website.
| Date | Buyer | Sale Price | Title Company |
|---|---|---|---|
| Ferrell Ronald | -- | None Available | |
| Ferrell Ronald J | $150,000 | Colonial Title Agency Inc | |
| Kiggans Harold | -- | -- |
Source: Public Records
Mortgage History
We collect this data history from publicly available records. To have your information removed, we recommend requesting removal directly through your county’s website.
| Date | Status | Borrower | Loan Amount |
|---|---|---|---|
| Open | Ferrell Ronald | $108,000 | |
| Closed | Ferrell Ronald J | $142,500 |
Source: Public Records
Tax History
| Year | Tax Paid | Tax Assessment Tax Assessment Total Assessment is a certain percentage of the fair market value that is determined by local assessors to be the total taxable value of land and additions on the property. | Land | Improvement |
|---|---|---|---|---|
| 2025 | $2,980 | $68,010 | $16,910 | $51,100 |
| 2024 | $2,722 | $68,010 | $16,910 | $51,100 |
| 2023 | $2,530 | $51,560 | $13,270 | $38,290 |
| 2022 | $2,530 | $51,560 | $13,270 | $38,290 |
| 2021 | $2,517 | $51,560 | $13,270 | $38,290 |
| 2020 | $2,425 | $45,190 | $13,270 | $31,920 |
| 2019 | $2,434 | $45,190 | $13,270 | $31,920 |
| 2018 | $1,890 | $33,920 | $9,380 | $24,540 |
| 2017 | $1,529 | $33,920 | $9,380 | $24,540 |
| 2016 | $1,513 | $33,920 | $9,380 | $24,540 |
| 2015 | $1,514 | $33,920 | $9,380 | $24,540 |
| 2014 | $1,473 | $33,920 | $9,380 | $24,540 |
| 2013 | $1,461 | $33,920 | $9,380 | $24,540 |
Source: Public Records
Map
Nearby Homes
- 992 Martin Rd
- 1660 Martin Rd
- 1427 Wood Fern Dr
- 1240 Winter Fern Ave
- 0 Randolph Rd Unit 5189131
- 998 Sunrise Way
- 3225 Brentwood Dr
- 994 Shaw Ave
- 3264 Sunny Brook Dr
- 4138 Whispering Springs Ln
- 1070 Congress Lake Rd
- 994 Bookman Ave
- 1520 Congress Lake Rd
- 258 Randolph Rd
- 3864 Louise St
- 3271 - 3275 Brunk Rd
- 460 Arehart Dr
- 1425 Galaxy Dr
- 3117 Dorchester Ct
- 13681 Kaufman Ave NW
- 690 Waterloo Rd
- 661 Ailene Dr
- 698 Waterloo Rd
- 705 Waterloo Rd
- 716 Waterloo Rd
- 660 Ailene Dr
- 725 Waterloo Rd
- 1219 Finley Dr
- 728 Waterloo Rd
- 733 Waterloo Rd
- 659 Waterloo Rd
- 745 Waterloo Rd
- 1239 Finley Dr
- 1232 Fox Ln
- 758 Waterloo Rd
- 755 Waterloo Rd
- 775 Waterloo Rd
- 1259 Finley Dr
- 765 Waterloo Rd
- 1260 Fox Ln
Your Personal Tour Guide
Ask me questions while you tour the home.