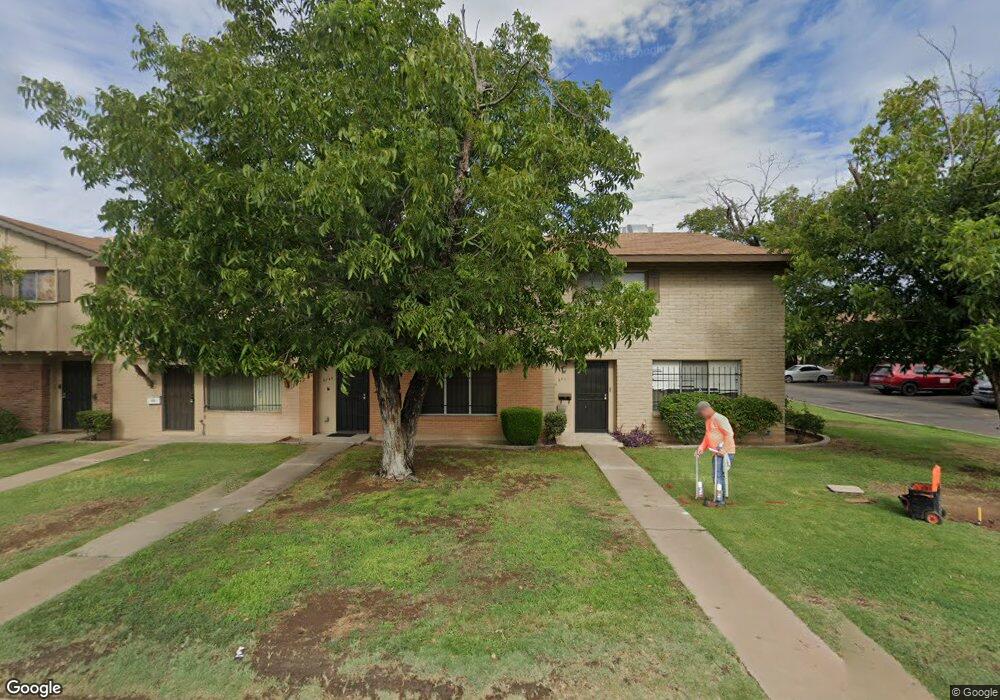
6760 N 43rd Ave Unit 289 Glendale, AZ 85301
Estimated Value: $232,355 - $269,000
3
Beds
3
Baths
1,576
Sq Ft
$160/Sq Ft
Est. Value
About This Home
This home is located at 6760 N 43rd Ave Unit 289, Glendale, AZ 85301 and is currently estimated at $251,589, approximately $159 per square foot. 6760 N 43rd Ave Unit 289 is a home located in Maricopa County with nearby schools including Barcelona Middle School, Alhambra High School, and Phoenix Coding Academy.
Ownership History
Date
Name
Owned For
Owner Type
Purchase Details
Closed on
Aug 1, 2002
Sold by
Shaw Erika L and Shaw James D
Bought by
Cardenas Arturo D
Current Estimated Value
Purchase Details
Closed on
Dec 26, 2001
Sold by
Nuno Sal A and Nuno Dana L
Bought by
Rojas Alejandro
Home Financials for this Owner
Home Financials are based on the most recent Mortgage that was taken out on this home.
Original Mortgage
$78,570
Interest Rate
6.84%
Mortgage Type
FHA
Purchase Details
Closed on
Sep 14, 1995
Sold by
First Interstate Bank Of Arizona Na
Bought by
Nuno Sal A and Nuno Dana L
Home Financials for this Owner
Home Financials are based on the most recent Mortgage that was taken out on this home.
Original Mortgage
$45,900
Interest Rate
7.88%
Mortgage Type
VA
Create a Home Valuation Report for This Property
The Home Valuation Report is an in-depth analysis detailing your home's value as well as a comparison with similar homes in the area
Home Values in the Area
Average Home Value in this Area
Purchase History
| Date | Buyer | Sale Price | Title Company |
|---|---|---|---|
| Cardenas Arturo D | $72,000 | Lawyers Title Of Arizona Inc | |
| Rojas Alejandro | $81,000 | Fidelity National Title | |
| Nuno Sal A | $45,000 | First American Title |
Source: Public Records
Mortgage History
| Date | Status | Borrower | Loan Amount |
|---|---|---|---|
| Previous Owner | Rojas Alejandro | $78,570 | |
| Previous Owner | Nuno Sal A | $45,900 |
Source: Public Records
Tax History Compared to Growth
Tax History
| Year | Tax Paid | Tax Assessment Tax Assessment Total Assessment is a certain percentage of the fair market value that is determined by local assessors to be the total taxable value of land and additions on the property. | Land | Improvement |
|---|---|---|---|---|
| 2025 | $527 | $3,870 | -- | -- |
| 2024 | $482 | $3,685 | -- | -- |
| 2023 | $482 | $17,400 | $3,480 | $13,920 |
| 2022 | $478 | $12,330 | $2,460 | $9,870 |
| 2021 | $489 | $11,010 | $2,200 | $8,810 |
| 2020 | $471 | $8,750 | $1,750 | $7,000 |
| 2019 | $468 | $7,850 | $1,570 | $6,280 |
| 2018 | $431 | $5,870 | $1,170 | $4,700 |
| 2017 | $428 | $5,130 | $1,020 | $4,110 |
| 2016 | $411 | $4,550 | $910 | $3,640 |
| 2015 | $400 | $4,020 | $800 | $3,220 |
Source: Public Records
Map
Nearby Homes
- 4331 W Lamar Rd
- 6765 N 44th Ave Unit 246
- 4332 W Ocotillo Rd Unit 206
- 6719 N 44th Ave
- 6654 N 43rd Ave
- 6537 N 41st Dr
- 7127 N 45th Ave
- 7127 N 45th Ave
- 6602 N 46th Ave
- 4232 W Citrus Way
- 4226 W Citrus Way
- 6605 N 46th Ln
- 7200 N 43rd Ave Unit 45
- 7200 N 43rd Ave Unit 55
- 6770 N 47th Ave Unit 2018
- 4342 W Claremont St
- 4310 W Rose Ln
- 4316 W Rose Ln
- 4137 W State Ave
- 4608 W Maryland Ave Unit 130
- 6760 N 43rd Ave
- 6758 N 43rd Ave
- 6762 N 43rd Ave
- 6756 N 43rd Ave Unit 287
- 6754 N 43rd Ave
- 6752 N 43rd Ave Unit 285
- 6744 N 43rd Ave Unit 273
- 6742 N 43rd Ave
- 6740 N 43rd Ave
- 6738 N 43rd Ave
- 6750 N 43rd Ave Unit 284
- 6736 N 43rd Ave Unit 277
- 4311 W Lamar Rd
- 4313 W Lamar Rd Unit 266
- 4307 W Lamar Rd Unit II
- 6748 N 43rd Ave Unit II
- 4309 W Lamar Rd Unit II
- 4317 W Lamar Rd
- 6734 N 43rd Ave
- 4315 W Lamar Rd Unit 265