Estimated Value: $1,725,000 - $2,420,000
4
Beds
5
Baths
3,155
Sq Ft
$644/Sq Ft
Est. Value
About This Home
This home is located at 6763 E 6725 N, Eden, UT 84310 and is currently estimated at $2,031,159, approximately $643 per square foot. 6763 E 6725 N is a home located in Weber County with nearby schools including Valley Elementary School, Snowcrest Junior High School, and Weber High School.
Ownership History
Date
Name
Owned For
Owner Type
Purchase Details
Closed on
Jan 14, 2021
Sold by
Colgate Craig and Colgate Carolyn
Bought by
Stark Andrew N
Current Estimated Value
Home Financials for this Owner
Home Financials are based on the most recent Mortgage that was taken out on this home.
Original Mortgage
$825,000
Outstanding Balance
$736,315
Interest Rate
2.71%
Mortgage Type
New Conventional
Estimated Equity
$1,294,844
Purchase Details
Closed on
Jun 14, 2005
Sold by
Powder Hound Ventrues Llc
Bought by
Colgate Craig
Purchase Details
Closed on
Jan 22, 2004
Sold by
Matthias Brian
Bought by
Powder Hound Ventures Llc
Purchase Details
Closed on
Jul 26, 2002
Sold by
Oki Chres H and Oki Yaeko D
Bought by
Matthias Brian
Create a Home Valuation Report for This Property
The Home Valuation Report is an in-depth analysis detailing your home's value as well as a comparison with similar homes in the area
Purchase History
| Date | Buyer | Sale Price | Title Company |
|---|---|---|---|
| Stark Andrew N | -- | First American Title Isn Co | |
| Colgate Craig | -- | Bonneville Title Company Sal | |
| Powder Hound Ventures Llc | -- | Bonneville Title | |
| Matthias Brian | -- | Bonneville Title |
Source: Public Records
Mortgage History
| Date | Status | Borrower | Loan Amount |
|---|---|---|---|
| Open | Stark Andrew N | $825,000 |
Source: Public Records
Tax History
| Year | Tax Paid | Tax Assessment Tax Assessment Total Assessment is a certain percentage of the fair market value that is determined by local assessors to be the total taxable value of land and additions on the property. | Land | Improvement |
|---|---|---|---|---|
| 2025 | $14,202 | $1,442,873 | $404,342 | $1,038,531 |
| 2024 | $12,726 | $1,313,000 | $360,219 | $952,781 |
| 2023 | $11,273 | $1,147,264 | $380,851 | $766,413 |
| 2022 | $6,649 | $1,251,298 | $360,758 | $890,540 |
| 2021 | $4,524 | $790,362 | $210,736 | $579,626 |
| 2020 | $4,503 | $724,000 | $185,713 | $538,287 |
| 2019 | $4,597 | $709,407 | $185,713 | $523,694 |
| 2018 | $4,454 | $659,977 | $185,613 | $474,364 |
| 2017 | $3,997 | $582,000 | $160,695 | $421,305 |
| 2016 | $4,055 | $319,904 | $88,249 | $231,655 |
| 2015 | $3,907 | $305,313 | $88,249 | $217,064 |
| 2014 | $3,518 | $268,351 | $88,249 | $180,102 |
Source: Public Records
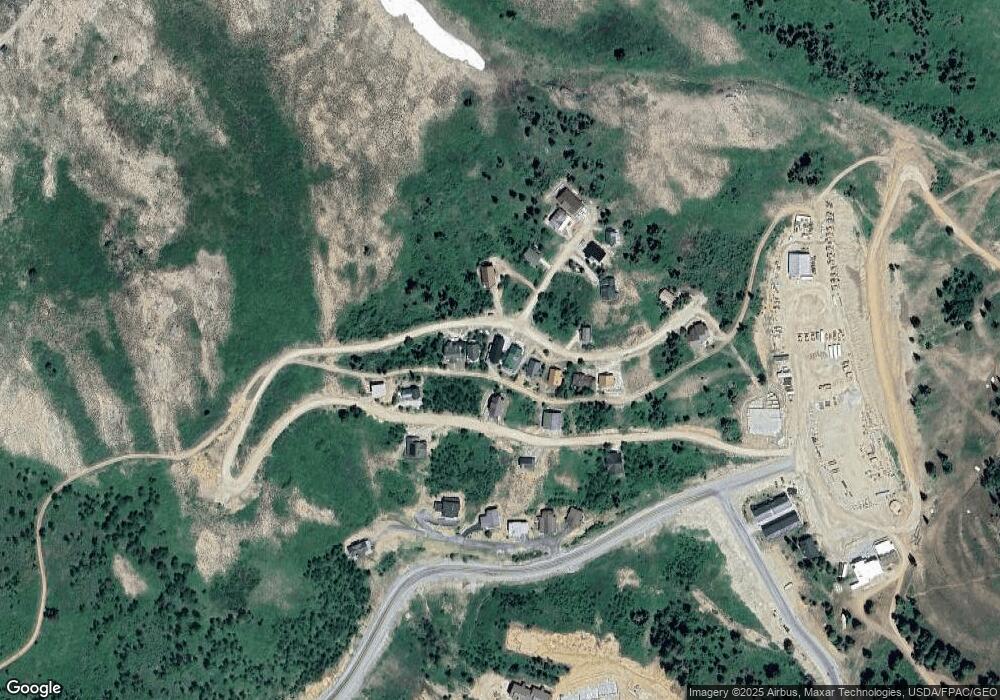
Map
Nearby Homes
- 6762 Aspen Dr
- 6838 E 6675 N Unit 2
- 6809 E 6725 N
- 6774 Chaparral Dr
- 6781 Chaparral Dr
- 6560 N Wolf Creek Dr Unit 4A
- 6560 N Wolf Creek Dr Unit 5B
- 6560 N Wolf Creek Dr Unit 4B
- 6560 N Wolf Creek Dr Unit 5A
- 6560 N Wolf Creek Dr Unit 2D
- 7918 Heartwood Dr E Unit 14
- 2300 N 5500 E
- 4993 N Powder Mountain Rd
- 8495 E Cobabe Ct
- 8452 E Spring Park Rd
- 8479 E Copper Crest Rd Unit 45
- 8514 E Overlook Dr
- 4489 N Powder Mountain Rd
- 4634 N Seven Bridges Rd Unit 27
- 4500 N Seven Bridges Rd Unit 18
- 6775 E 6725 N
- 6822 E 6725 N
- 6784 E 6725 N
- 6784 E 6725 N Unit 35
- 6744 Chaparral Dr
- 6741 E 6725 N Unit 12
- 6746 Aspen Dr
- 6762 E 4650 N
- 6742 Aspen Dr
- 6791 E 6725 N
- 6719 E 6725 N Unit 41R
- 6791 Aspen Dr Unit 7
- 6781 Aspen Dr Unit 8
- 6824 Aspen Dr Unit 32
- 6739 Aspen Dr Unit 45
- 6734 Aspen Dr Unit 39
- 6767 Aspen Dr Unit 47
- 6801 E 6725 N
- 6810 E 6725 N Unit 28
- 6720 E 4650 N
Your Personal Tour Guide
Ask me questions while you tour the home.