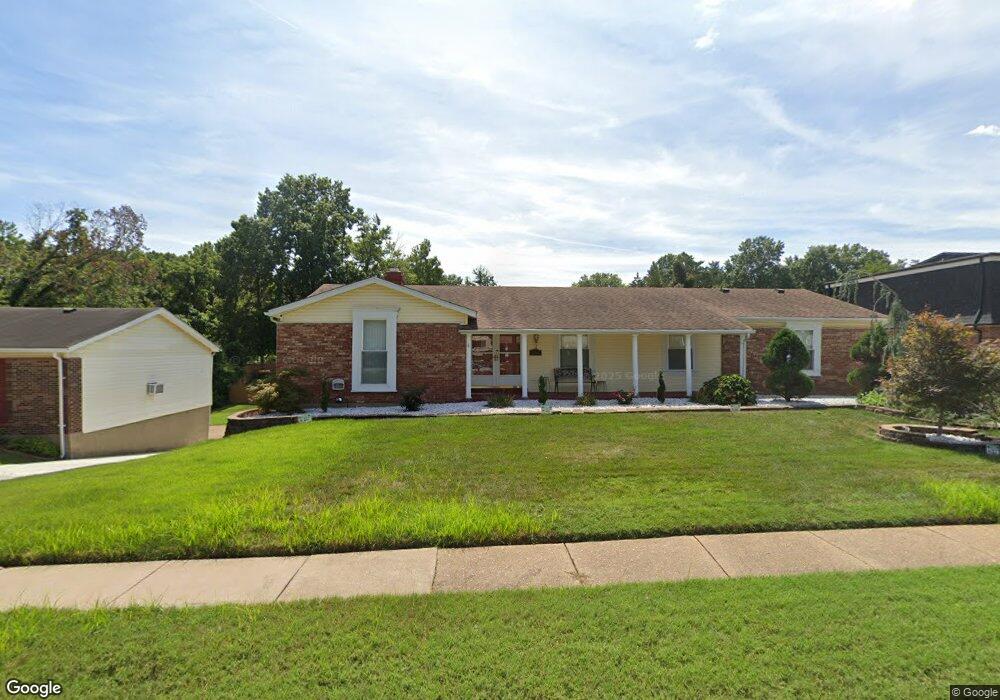
6764 Chilham Dr Florissant, MO 63033
Estimated Value: $224,000 - $274,000
4
Beds
3
Baths
2,054
Sq Ft
$121/Sq Ft
Est. Value
About This Home
This home is located at 6764 Chilham Dr, Florissant, MO 63033 and is currently estimated at $249,205, approximately $121 per square foot. 6764 Chilham Dr is a home located in St. Louis County with nearby schools including Townsend Elementary School, Central Middle School, and Hazelwood Central High School.
Ownership History
Date
Name
Owned For
Owner Type
Purchase Details
Closed on
Nov 14, 2006
Sold by
Anthony Laconey and Anthony Brenda D
Bought by
Shorter Mark and Shorter Jermita
Current Estimated Value
Home Financials for this Owner
Home Financials are based on the most recent Mortgage that was taken out on this home.
Original Mortgage
$189,900
Outstanding Balance
$113,586
Interest Rate
6.41%
Mortgage Type
Purchase Money Mortgage
Estimated Equity
$135,619
Purchase Details
Closed on
Jan 10, 2000
Sold by
Wilson David L and Wilson Flossie M
Bought by
Anthony Ii Laconey and Anthony Brenda D
Home Financials for this Owner
Home Financials are based on the most recent Mortgage that was taken out on this home.
Original Mortgage
$125,750
Interest Rate
7.86%
Mortgage Type
VA
Create a Home Valuation Report for This Property
The Home Valuation Report is an in-depth analysis detailing your home's value as well as a comparison with similar homes in the area
Home Values in the Area
Average Home Value in this Area
Purchase History
| Date | Buyer | Sale Price | Title Company |
|---|---|---|---|
| Shorter Mark | $189,900 | None Available | |
| Anthony Ii Laconey | $122,400 | -- |
Source: Public Records
Mortgage History
| Date | Status | Borrower | Loan Amount |
|---|---|---|---|
| Open | Shorter Mark | $189,900 | |
| Previous Owner | Anthony Ii Laconey | $125,750 |
Source: Public Records
Tax History Compared to Growth
Tax History
| Year | Tax Paid | Tax Assessment Tax Assessment Total Assessment is a certain percentage of the fair market value that is determined by local assessors to be the total taxable value of land and additions on the property. | Land | Improvement |
|---|---|---|---|---|
| 2025 | $3,935 | $47,240 | $3,460 | $43,780 |
| 2024 | $3,935 | $43,320 | $3,460 | $39,860 |
| 2023 | $3,921 | $43,320 | $3,460 | $39,860 |
| 2022 | $3,390 | $33,290 | $7,660 | $25,630 |
| 2021 | $3,209 | $33,290 | $7,660 | $25,630 |
| 2020 | $3,002 | $29,000 | $5,740 | $23,260 |
| 2019 | $2,954 | $29,000 | $5,740 | $23,260 |
| 2018 | $2,342 | $21,210 | $3,860 | $17,350 |
| 2017 | $2,340 | $21,210 | $3,860 | $17,350 |
| 2016 | $2,935 | $26,240 | $3,080 | $23,160 |
| 2015 | $2,868 | $26,240 | $3,080 | $23,160 |
| 2014 | $2,658 | $24,190 | $4,810 | $19,380 |
Source: Public Records
Map
Nearby Homes
- 6787 Lesli Mari Ct
- 12713 Partridge Run Dr
- 6646 Foothills Ct
- 6803 Foxbend Ct
- 6862 Foxbend Ct
- 6665 Lakeside Hills Dr
- 12432 Quatre Dr
- 12225 Tarpon Dr
- 12435 Sea Lane Dr Unit 5
- 6470 White Cap Ln Unit D
- 12456 Sea Lane Dr Unit A
- 6587 Dolphin Cir E Unit 110B
- 6595 Dolphin Cir E Unit 131A
- 12750 Needle Point Ct
- 6360 Silver Fox Dr
- 12705 Stubwood Dr
- 12845 Meadowdale Dr
- 17 Nob Hill Dr
- 12320 Missile Ln
- 1828 Arrowpoint Dr
- 6754 Chilham Dr
- 6774 Chilham Dr
- 5 Farm Country Ct
- 3 Farm Country Ct
- 6744 Chilham Dr
- 6763 Chilham Dr
- 6753 Chilham Dr
- 12649 Flower Crest Ct
- 6773 Chilham Dr
- 12643 Flower Crest Ct
- 1 Farm Country Ct
- 8 Farm Country Ct
- 12637 Flower Crest Ct
- 6743 Chilham Dr
- 6783 Chilham Dr
- 6 Ipswich Ct
- 6793 Chilham Dr
- 6 Farm Country Ct
- 4 Ipswich Ct
- 4 Farm Country Ct