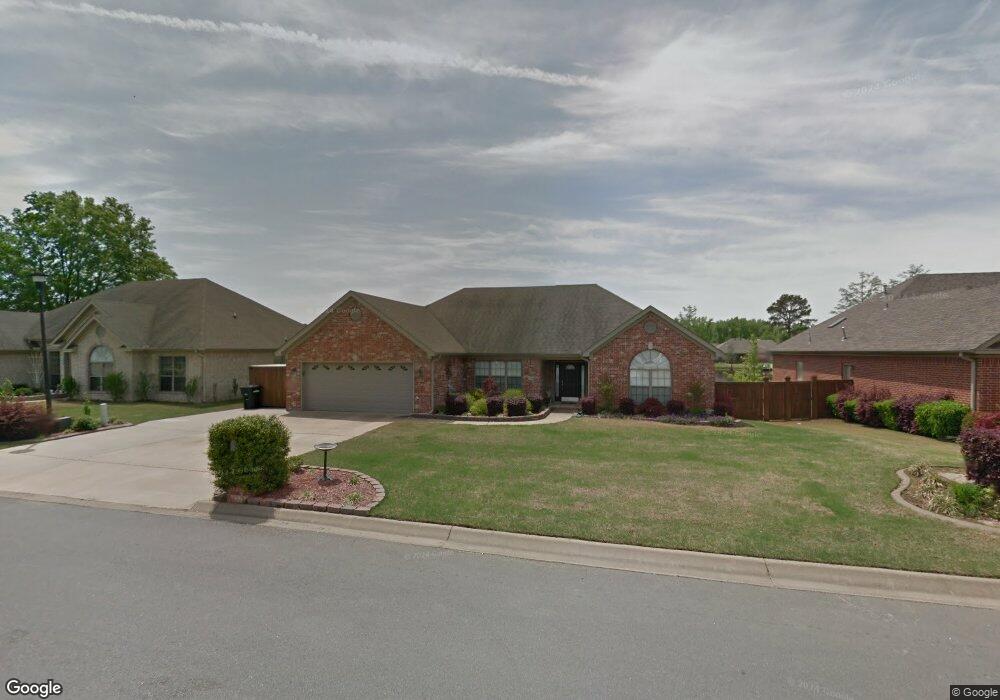
6765 Austin Bay Ct Sherwood, AR 72120
Estimated Value: $392,242 - $450,000
--
Bed
2
Baths
2,706
Sq Ft
$155/Sq Ft
Est. Value
About This Home
This home is located at 6765 Austin Bay Ct, Sherwood, AR 72120 and is currently estimated at $419,311, approximately $154 per square foot. 6765 Austin Bay Ct is a home located in Pulaski County with nearby schools including Clinton Elementary School, Sylvan Hills Middle School, and Sylvan Hills High School.
Ownership History
Date
Name
Owned For
Owner Type
Purchase Details
Closed on
Oct 16, 2020
Sold by
Henson Steve and Henson Elise
Bought by
Jacks Terry and Jacks Kaysi
Current Estimated Value
Home Financials for this Owner
Home Financials are based on the most recent Mortgage that was taken out on this home.
Original Mortgage
$316,825
Outstanding Balance
$281,285
Interest Rate
2.8%
Mortgage Type
New Conventional
Estimated Equity
$138,026
Purchase Details
Closed on
Mar 17, 2016
Sold by
Crook Todd A and Crook Sherri
Bought by
Henson Steve and Henson Elise
Purchase Details
Closed on
Mar 19, 2004
Sold by
Jon Young Homebuilders Inc
Bought by
Crook Todd A and Crook Sherri L
Home Financials for this Owner
Home Financials are based on the most recent Mortgage that was taken out on this home.
Original Mortgage
$171,000
Interest Rate
5.64%
Mortgage Type
Purchase Money Mortgage
Create a Home Valuation Report for This Property
The Home Valuation Report is an in-depth analysis detailing your home's value as well as a comparison with similar homes in the area
Home Values in the Area
Average Home Value in this Area
Purchase History
| Date | Buyer | Sale Price | Title Company |
|---|---|---|---|
| Jacks Terry | $333,500 | Beach Abstract & Guaranty Co | |
| Henson Steve | $295,000 | Waco Title Co Little Rock | |
| Crook Todd A | $180,000 | Lenders Title Co |
Source: Public Records
Mortgage History
| Date | Status | Borrower | Loan Amount |
|---|---|---|---|
| Open | Jacks Terry | $316,825 | |
| Previous Owner | Crook Todd A | $171,000 |
Source: Public Records
Tax History Compared to Growth
Tax History
| Year | Tax Paid | Tax Assessment Tax Assessment Total Assessment is a certain percentage of the fair market value that is determined by local assessors to be the total taxable value of land and additions on the property. | Land | Improvement |
|---|---|---|---|---|
| 2025 | $3,282 | $62,999 | $7,018 | $55,981 |
| 2024 | $3,282 | $62,999 | $7,018 | $55,981 |
| 2023 | $3,282 | $62,999 | $7,018 | $55,981 |
| 2022 | $3,472 | $62,999 | $7,018 | $55,981 |
| 2021 | $3,095 | $54,980 | $12,800 | $42,180 |
| 2020 | $3,084 | $54,980 | $12,800 | $42,180 |
| 2019 | $3,084 | $54,980 | $12,800 | $42,180 |
| 2018 | $3,084 | $54,980 | $12,800 | $42,180 |
| 2017 | $3,068 | $54,980 | $12,800 | $42,180 |
| 2016 | $2,226 | $45,520 | $6,200 | $39,320 |
| 2015 | $2,312 | $45,520 | $6,200 | $39,320 |
| 2014 | $2,312 | $45,520 | $6,200 | $39,320 |
Source: Public Records
Map
Nearby Homes
- 6608 Southshore Ln
- 6 W Laramie Dr
- 106 Winona Dr
- 606 Bay View Ct
- 201 Bearskin Dr
- 404 May St
- 400 Cherrie Ave
- 7524 Glenn Hills Dr
- 401 Calloway Ave
- 309 May St
- 3600 E Kiehl Ave
- 2226 Bearskin Dr
- 11 Whalen Place
- 7416 Glenn Hills Dr
- 608 Hemphill Rd
- 300 Calloway Ave
- 3116 Maxine Ave
- 208 Calloway Ave
- 2216 Sage Meadows Cir
- 2125 Gap Creek Dr
- 6801 Austin Bay Ct
- 6757 Austin Bay Ct
- 6809 Austin Bay Ct
- 6749 Austin Bay Ct
- 6800 Austin Bay Ct
- 3100 Bay Cove
- 6817 Austin Bay Ct
- 6741 Austin Bay Ct
- 6808 Austin Bay Ct
- 6901 Austin Bay Ct
- 6748 Austin Bay Ct
- 3109 Bay Cove
- 3108 Bay Cove
- 3108 Austin Bayside Dr
- 6909 Austin Bay Ct
- 6725 Austin Bay Ct
- 3117 Bay Cove
- 6900 Austin Bay Ct
- 3116 Bay Cove
- 6740 Austin Bay Ct