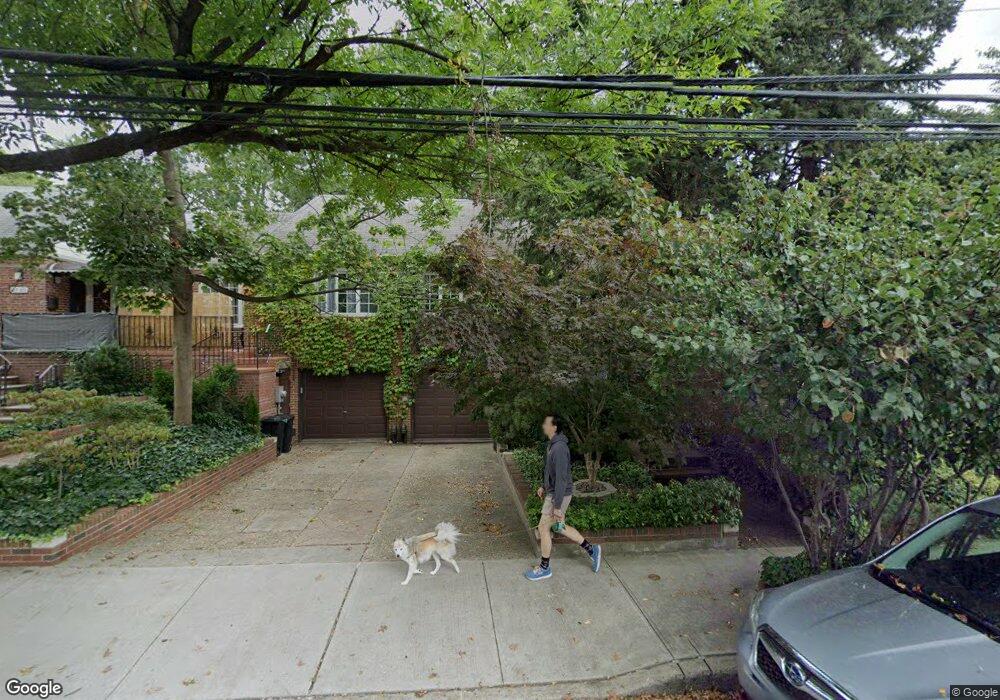
6769 Alderton St Rego Park, NY 11374
Rego Park NeighborhoodEstimated Value: $866,000 - $1,023,000
--
Bed
--
Bath
1,687
Sq Ft
$554/Sq Ft
Est. Value
About This Home
This home is located at 6769 Alderton St, Rego Park, NY 11374 and is currently estimated at $935,126, approximately $554 per square foot. 6769 Alderton St is a home located in Queens County with nearby schools including P.S. 174 - William Sidney Mount, J.H.S. 190 Russell Sage, and Queens Metropolitan High School.
Ownership History
Date
Name
Owned For
Owner Type
Purchase Details
Closed on
Feb 22, 2001
Sold by
Gallagher Michael S
Bought by
Gallagher Michael S and Crisostomo Gema Alava
Current Estimated Value
Purchase Details
Closed on
Dec 21, 2000
Sold by
Yardeny Gil and Yardeny Ingrid Peralta
Bought by
Gallagher Michael S
Home Financials for this Owner
Home Financials are based on the most recent Mortgage that was taken out on this home.
Original Mortgage
$252,000
Outstanding Balance
$92,463
Interest Rate
7.64%
Estimated Equity
$842,663
Purchase Details
Closed on
Aug 28, 1997
Sold by
Mulieri Anthony
Bought by
Yardeny Gil and Peralta Ingrid
Home Financials for this Owner
Home Financials are based on the most recent Mortgage that was taken out on this home.
Original Mortgage
$227,000
Interest Rate
7.26%
Create a Home Valuation Report for This Property
The Home Valuation Report is an in-depth analysis detailing your home's value as well as a comparison with similar homes in the area
Home Values in the Area
Average Home Value in this Area
Purchase History
| Date | Buyer | Sale Price | Title Company |
|---|---|---|---|
| Gallagher Michael S | -- | -- | |
| Gallagher Michael S | -- | -- | |
| Gallagher Michael S | $315,000 | First American Title Ins Co | |
| Gallagher Michael S | $315,000 | First American Title Ins Co | |
| Yardeny Gil | $239,000 | -- | |
| Yardeny Gil | $239,000 | -- |
Source: Public Records
Mortgage History
| Date | Status | Borrower | Loan Amount |
|---|---|---|---|
| Open | Gallagher Michael S | $252,000 | |
| Closed | Gallagher Michael S | $252,000 | |
| Previous Owner | Yardeny Gil | $227,000 |
Source: Public Records
Tax History Compared to Growth
Tax History
| Year | Tax Paid | Tax Assessment Tax Assessment Total Assessment is a certain percentage of the fair market value that is determined by local assessors to be the total taxable value of land and additions on the property. | Land | Improvement |
|---|---|---|---|---|
| 2025 | $8,933 | $45,899 | $16,343 | $29,556 |
| 2024 | $8,933 | $44,476 | $18,024 | $26,452 |
| 2023 | $8,427 | $41,959 | $14,456 | $27,503 |
| 2022 | $8,068 | $56,340 | $18,480 | $37,860 |
| 2021 | $8,052 | $52,500 | $18,480 | $34,020 |
| 2020 | $8,096 | $54,720 | $18,480 | $36,240 |
| 2019 | $7,753 | $60,300 | $18,480 | $41,820 |
| 2018 | $7,128 | $34,966 | $14,096 | $20,870 |
| 2017 | $6,865 | $33,679 | $14,171 | $19,508 |
| 2016 | $6,374 | $33,679 | $14,171 | $19,508 |
| 2015 | $3,832 | $31,874 | $18,352 | $13,522 |
| 2014 | $3,832 | $30,886 | $19,136 | $11,750 |
Source: Public Records
Map
Nearby Homes
- 85-62 67th Dr
- 66-92 Selfridge St Unit 3J
- 66-92 Selfridge St Unit 1E
- 66-92 Selfridge St Unit 3E
- 74-45 Yellowstone Blvd Unit 1A
- 7445 Yellowstone Blvd Unit 5G
- 7445 Yellowstone Blvd Unit 5C
- 7445 Yellowstone Blvd Unit 2A
- 68-09 Alderton St
- 8545 67th Dr
- 7510 Yellowstone Blvd Unit 2C
- 91-11 68th Ave
- 72-89 Yellowstone Blvd
- 90-01 68th Ave
- 7285 Yellowstone Blvd
- 6897 Alderton St
- 67-31 Ingram St
- 69-01 Alderton St
- 85-82 66th Rd
- 85-76 66th Rd
- 6767 Alderton St
- 6771 Alderton St
- 6765 Alderton St
- 6773 Alderton St
- 6763 Alderton St
- 6777 Alderton St
- 67-77 Alderton St
- 67-77 Alderton St Unit 2
- 6761 Alderton St
- 67-61 Alderton St
- 6779 Alderton St
- 67-59 Alderton St
- 6759 Alderton St
- 6781 Alderton St Unit 2Fl
- 6781 Alderton St
- 67-81 Alderton St
- 67-81 Alderton St Unit 2
- 67-81 Alderton St Unit 2F
- 67-81 Alderton St Unit 2,3 Fl
- 8547 68th Ave