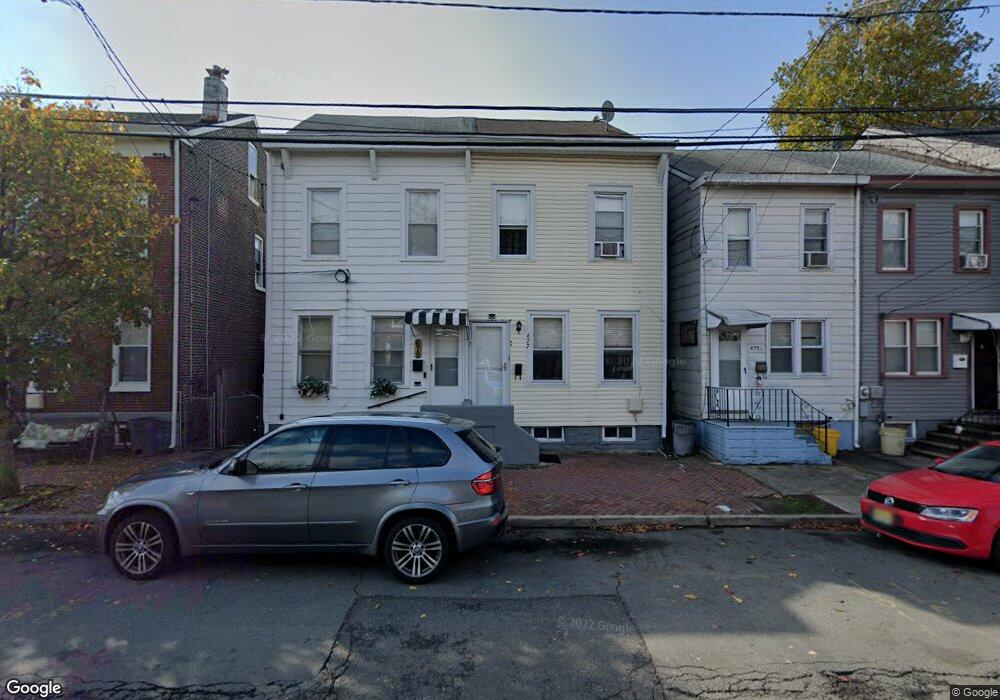
677 2nd St Trenton, NJ 08611
South Trenton NeighborhoodEstimated Value: $154,954 - $231,000
--
Bed
--
Bath
1,328
Sq Ft
$147/Sq Ft
Est. Value
About This Home
This home is located at 677 2nd St, Trenton, NJ 08611 and is currently estimated at $195,489, approximately $147 per square foot. 677 2nd St is a home located in Mercer County with nearby schools including Mott Elementary School, Parker Elementary School, and Grace A Dunn Middle School.
Ownership History
Date
Name
Owned For
Owner Type
Purchase Details
Closed on
Sep 26, 2006
Current Estimated Value
Purchase Details
Closed on
Jun 26, 1996
Sold by
Heredia Nelson
Bought by
Castro Sabase and Castro Mirtala
Home Financials for this Owner
Home Financials are based on the most recent Mortgage that was taken out on this home.
Original Mortgage
$43,000
Interest Rate
8.05%
Mortgage Type
FHA
Create a Home Valuation Report for This Property
The Home Valuation Report is an in-depth analysis detailing your home's value as well as a comparison with similar homes in the area
Home Values in the Area
Average Home Value in this Area
Purchase History
| Date | Buyer | Sale Price | Title Company |
|---|---|---|---|
| -- | -- | -- | |
| Castro Mirtala | -- | Etitle Solutions | |
| Castro Mirtala | -- | Etitle Solutions | |
| Castro Sabase | $43,000 | -- |
Source: Public Records
Mortgage History
| Date | Status | Borrower | Loan Amount |
|---|---|---|---|
| Previous Owner | Castro Sabase | $43,000 |
Source: Public Records
Tax History Compared to Growth
Tax History
| Year | Tax Paid | Tax Assessment Tax Assessment Total Assessment is a certain percentage of the fair market value that is determined by local assessors to be the total taxable value of land and additions on the property. | Land | Improvement |
|---|---|---|---|---|
| 2025 | $3,370 | $58,100 | $8,300 | $49,800 |
| 2024 | $3,234 | $58,100 | $8,300 | $49,800 |
| 2023 | $3,234 | $58,100 | $8,300 | $49,800 |
| 2022 | $3,171 | $58,100 | $8,300 | $49,800 |
| 2021 | $3,226 | $58,100 | $8,300 | $49,800 |
| 2020 | $3,216 | $58,100 | $8,300 | $49,800 |
| 2019 | $3,164 | $58,100 | $8,300 | $49,800 |
| 2018 | $3,029 | $58,100 | $8,300 | $49,800 |
| 2017 | $2,879 | $58,100 | $8,300 | $49,800 |
| 2016 | $2,416 | $42,000 | $13,100 | $28,900 |
| 2015 | $2,408 | $42,000 | $13,100 | $28,900 |
| 2014 | $2,397 | $42,000 | $13,100 | $28,900 |
Source: Public Records
Map
Nearby Homes