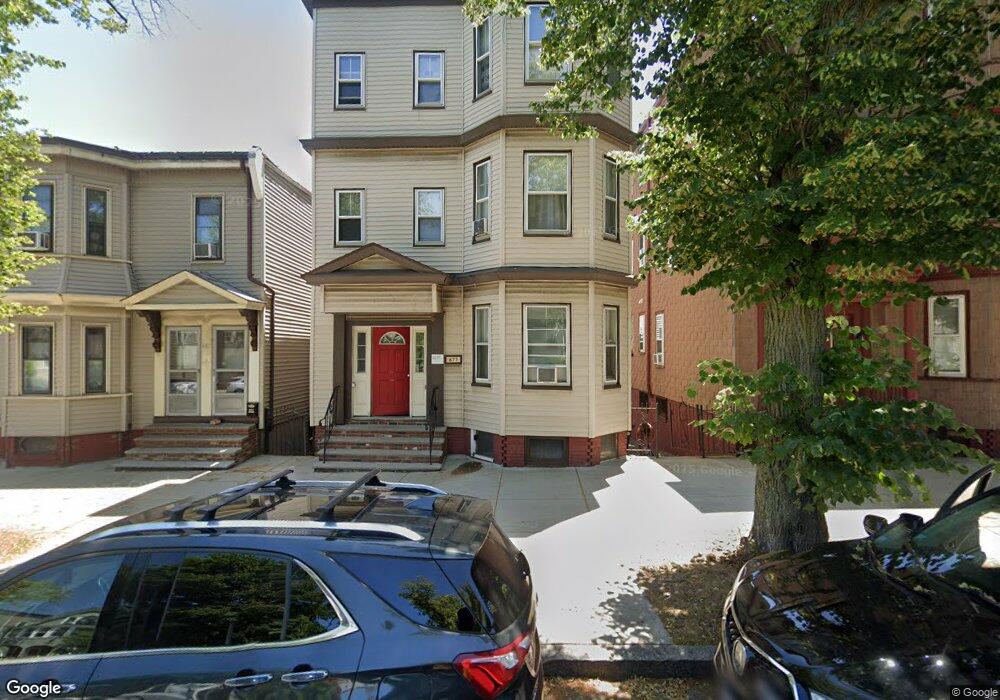
677 Bennington St Boston, MA 02128
Harbor View-Orient Heights NeighborhoodEstimated Value: $1,006,000 - $1,371,000
About This Home
City View(s) Deck Dishwasher Driveway Duplex Enclosed Porch Free Laundry Granite Counter Tops Hardwood Floors High Ceiling Laundry in Basement Laundry in Building Modern Modern Bath Modern Kitchen New/Renovated Bath New/Renovated Kitchen New Appliances New Renovation Parking Included Porch PROFESSIONALLY MANAGED Top Floor Updated Kitchen Video Tour
223342 502
Ownership History
We collect this data history from publicly available records. To have your information removed, we recommend requesting removal directly through your county’s website.
Purchase Details
Home Values in the Area
Average Home Value in this Area
Purchase History
We collect this data history from publicly available records. To have your information removed, we recommend requesting removal directly through your county’s website.
| Date | Buyer | Sale Price | Title Company |
|---|---|---|---|
| $130,000 | -- |
Property History
We collect this data history from publicly available records. To have your information removed, we recommend requesting removal directly through your county’s website.
| Date | Event | Price | List to Sale | Price per Sq Ft |
|---|---|---|---|---|
| 10/08/2024 10/08/24 | Off Market | $4,500 | -- | -- |
| 08/31/2024 08/31/24 | For Rent | $4,500 | -- | -- |
Tax History
We collect this data history from publicly available records. To have your information removed, we recommend requesting removal directly through your county’s website.
| Year | Tax Paid | Tax Assessment Tax Assessment Total Assessment is a certain percentage of the fair market value that is determined by local assessors to be the total taxable value of land and additions on the property. | Land | Improvement |
|---|---|---|---|---|
| 2025 | $10,397 | $897,800 | $226,600 | $671,200 |
| 2024 | $10,450 | $958,700 | $220,100 | $738,600 |
| 2023 | $9,621 | $895,800 | $205,600 | $690,200 |
| 2022 | $9,466 | $870,000 | $199,700 | $670,300 |
| 2021 | $8,595 | $805,500 | $184,900 | $620,600 |
| 2020 | $5,843 | $553,300 | $149,900 | $403,400 |
| 2019 | $5,208 | $494,100 | $101,700 | $392,400 |
| 2018 | $4,624 | $441,200 | $101,700 | $339,500 |
| 2017 | $4,171 | $393,900 | $101,700 | $292,200 |
| 2016 | $4,127 | $375,200 | $101,700 | $273,500 |
| 2015 | $3,919 | $323,600 | $87,400 | $236,200 |
| 2014 | $3,569 | $283,700 | $87,400 | $196,300 |
Map
- 138 Horace St Unit 3
- 839 Saratoga St Unit 3
- 841 Saratoga St Unit 3
- 804 Saratoga St Unit 3
- 804 Saratoga St Unit 1
- 804 Saratoga St Unit 2
- 804 Saratoga St
- 855 Saratoga St
- 181 Cowper St Unit 302
- 103-105 Homer St
- 198 Byron St
- 176 Coleridge St
- 601 Bennington St Unit 2
- 74 Horace St Unit 3
- 43 Wordsworth St Unit 3
- 58 Homer St Unit 1
- 95 Addison St Unit 308
- 910 Saratoga St Unit 20
- 64 Byron St Unit 2
- 549 Bennington St
- 148 Horace St Unit 3
- 148 Horace St Unit 2
- 148 Horace St Unit 1
- 148 Horace St
- 142 Horace St Unit 3
- 142 Horace St Unit 2
- 142 Horace St Unit 1
- 142 Horace St
- 138 Horace St Unit 2
- 138 Horace St Unit 1
- 132 Horace St
- 134 Horace St
- 669 Bennington St
- 675 Bennington St
- 137 Horace St
- 673 Bennington St
- 673 Bennington St Unit 3
- 677 Bennington St
- 677 Bennington St Unit 3
- 677 Bennington St Unit 2
Ask me questions while you tour the home.