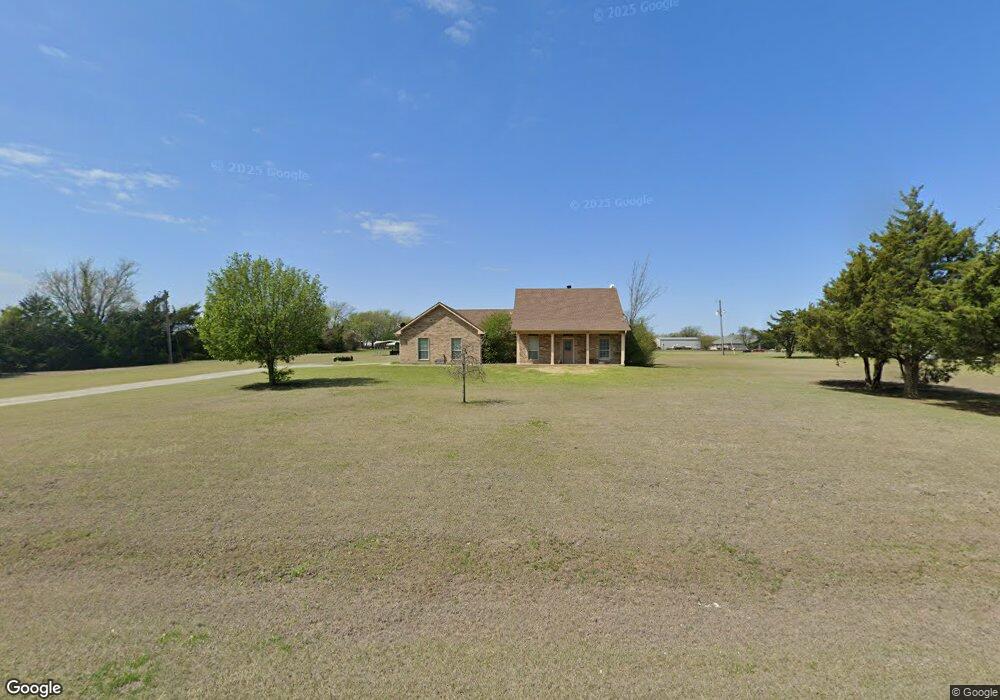
677 County Road 4444 Trenton, TX 75490
Estimated Value: $417,755 - $432,000
3
Beds
2
Baths
1,828
Sq Ft
$231/Sq Ft
Est. Value
About This Home
This home is located at 677 County Road 4444, Trenton, TX 75490 and is currently estimated at $422,189, approximately $230 per square foot. 677 County Road 4444 is a home located in Fannin County with nearby schools including Trenton Elementary School, Trenton Middle School, and Trenton High School.
Ownership History
Date
Name
Owned For
Owner Type
Purchase Details
Closed on
Jun 7, 2016
Sold by
Anderson Jeffrey F and Anderson Maya R
Bought by
Reeder Terry G and Reeder Misty R
Current Estimated Value
Home Financials for this Owner
Home Financials are based on the most recent Mortgage that was taken out on this home.
Original Mortgage
$196,377
Outstanding Balance
$156,975
Interest Rate
3.87%
Mortgage Type
FHA
Estimated Equity
$265,214
Purchase Details
Closed on
Oct 10, 2014
Sold by
Owens Tom and Owens Becky
Bought by
Anderson Jeffrey F and Anderson Maya R
Home Financials for this Owner
Home Financials are based on the most recent Mortgage that was taken out on this home.
Original Mortgage
$153,000
Interest Rate
4.62%
Mortgage Type
Adjustable Rate Mortgage/ARM
Create a Home Valuation Report for This Property
The Home Valuation Report is an in-depth analysis detailing your home's value as well as a comparison with similar homes in the area
Home Values in the Area
Average Home Value in this Area
Purchase History
| Date | Buyer | Sale Price | Title Company |
|---|---|---|---|
| Reeder Terry G | -- | Cole Title Company | |
| Anderson Jeffrey F | -- | Fannin County Title Company |
Source: Public Records
Mortgage History
| Date | Status | Borrower | Loan Amount |
|---|---|---|---|
| Open | Reeder Terry G | $196,377 | |
| Previous Owner | Anderson Jeffrey F | $153,000 |
Source: Public Records
Tax History Compared to Growth
Tax History
| Year | Tax Paid | Tax Assessment Tax Assessment Total Assessment is a certain percentage of the fair market value that is determined by local assessors to be the total taxable value of land and additions on the property. | Land | Improvement |
|---|---|---|---|---|
| 2025 | $4,400 | $438,480 | $164,010 | $274,470 |
| 2024 | $4,400 | $437,250 | $146,500 | $290,750 |
| 2023 | $5,211 | $395,710 | $120,930 | $274,780 |
| 2022 | $4,451 | $346,510 | $87,730 | $258,780 |
| 2021 | $4,581 | $275,200 | $48,170 | $227,030 |
| 2020 | $4,385 | $257,220 | $40,610 | $216,610 |
| 2019 | $4,312 | $236,270 | $33,180 | $203,090 |
| 2018 | $3,998 | $200,180 | $31,080 | $169,100 |
| 2017 | $3,636 | $177,380 | $21,810 | $155,570 |
| 2016 | $3,454 | $168,480 | $21,610 | $146,870 |
| 2015 | -- | $157,390 | $18,010 | $139,380 |
| 2014 | -- | $177,550 | $18,470 | $159,080 |
Source: Public Records
Map
Nearby Homes
- 432 County Road 4444
- 434 County Road 4445
- 10492 U S 69
- LOT 1 County Rd 4534
- TBD N Highway 69
- 549 Augustus St
- 513 Augustus St
- TBD Lot 4 County Road 4535
- TBD Lot 2 County Road 4535
- TBD Lot 3 County Road 4535
- 211 Church St
- 304 Kelcey Ct
- 313 Kelcey Ct
- 301 Kelcey Ct
- Lot 9 Kelcey Ct
- Lot 10 Kelcey Ct
- Lot 8 Kelcey Ct
- Lot 7 Kelcey Ct
- Lot 1 Kelcey Ct
- 210 Carrie Mabrie St
- 687 County Road 4444
- 650 County Road 4444
- 684 County Road 4444
- 633 County Road 4444
- 606 County Road 4444
- 753 County Road 4444
- 547 County Road 4445
- 760 County Road 4444
- 469 County Road 4445
- 457 County Road 4445
- 595 County Road 4445
- 530 County Road 4444
- 780 County Road 4444
- 557 County Road 4444
- 401 County Road 4445
- tbd County Road 4445
- 000 County Road 4445
- 445 County Road 4444
- 627 County Road 4445
- 833 County Road 4444