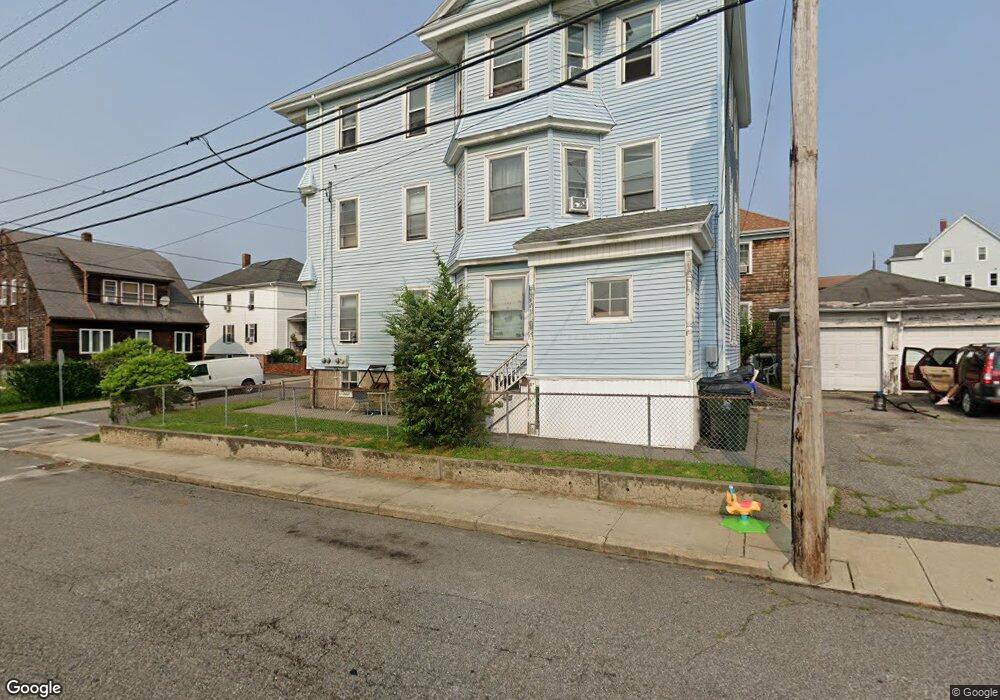
677 Hicks St Fall River, MA 02724
Sandy Beach NeighborhoodEstimated Value: $466,755 - $728,000
6
Beds
3
Baths
3,609
Sq Ft
$165/Sq Ft
Est. Value
About This Home
This home is located at 677 Hicks St, Fall River, MA 02724 and is currently estimated at $594,439, approximately $164 per square foot. 677 Hicks St is a home located in Bristol County with nearby schools including Carlton M. Viveiros Elementary School, Matthew J. Kuss Middle School, and B M C Durfee High School.
Ownership History
Date
Name
Owned For
Owner Type
Purchase Details
Closed on
Oct 13, 2000
Sold by
Ringuest Janet R and Ringuest Jeffrey L
Bought by
Arruda Jay K
Current Estimated Value
Home Financials for this Owner
Home Financials are based on the most recent Mortgage that was taken out on this home.
Original Mortgage
$100,000
Interest Rate
7.89%
Mortgage Type
Purchase Money Mortgage
Create a Home Valuation Report for This Property
The Home Valuation Report is an in-depth analysis detailing your home's value as well as a comparison with similar homes in the area
Home Values in the Area
Average Home Value in this Area
Purchase History
| Date | Buyer | Sale Price | Title Company |
|---|---|---|---|
| Arruda Jay K | $137,500 | -- |
Source: Public Records
Mortgage History
| Date | Status | Borrower | Loan Amount |
|---|---|---|---|
| Open | Arruda Jay K | $97,786 | |
| Closed | Arruda Jay K | $100,000 | |
| Closed | Arruda Jay K | $100,000 |
Source: Public Records
Tax History
| Year | Tax Paid | Tax Assessment Tax Assessment Total Assessment is a certain percentage of the fair market value that is determined by local assessors to be the total taxable value of land and additions on the property. | Land | Improvement |
|---|---|---|---|---|
| 2025 | $5,842 | $510,200 | $116,900 | $393,300 |
| 2024 | $5,627 | $489,700 | $114,600 | $375,100 |
| 2023 | $5,166 | $421,000 | $103,300 | $317,700 |
| 2022 | $4,623 | $366,300 | $97,400 | $268,900 |
| 2021 | $3,100 | $296,300 | $93,100 | $203,200 |
| 2020 | $3,696 | $255,800 | $88,800 | $167,000 |
| 2019 | $3,318 | $227,600 | $92,900 | $134,700 |
| 2018 | $3,146 | $215,200 | $93,500 | $121,700 |
| 2017 | $3,013 | $215,200 | $93,500 | $121,700 |
| 2016 | $2,935 | $215,300 | $96,400 | $118,900 |
| 2015 | $2,816 | $215,300 | $96,400 | $118,900 |
| 2014 | $2,841 | $225,800 | $96,400 | $129,400 |
Source: Public Records
Map
Nearby Homes
Your Personal Tour Guide
Ask me questions while you tour the home.