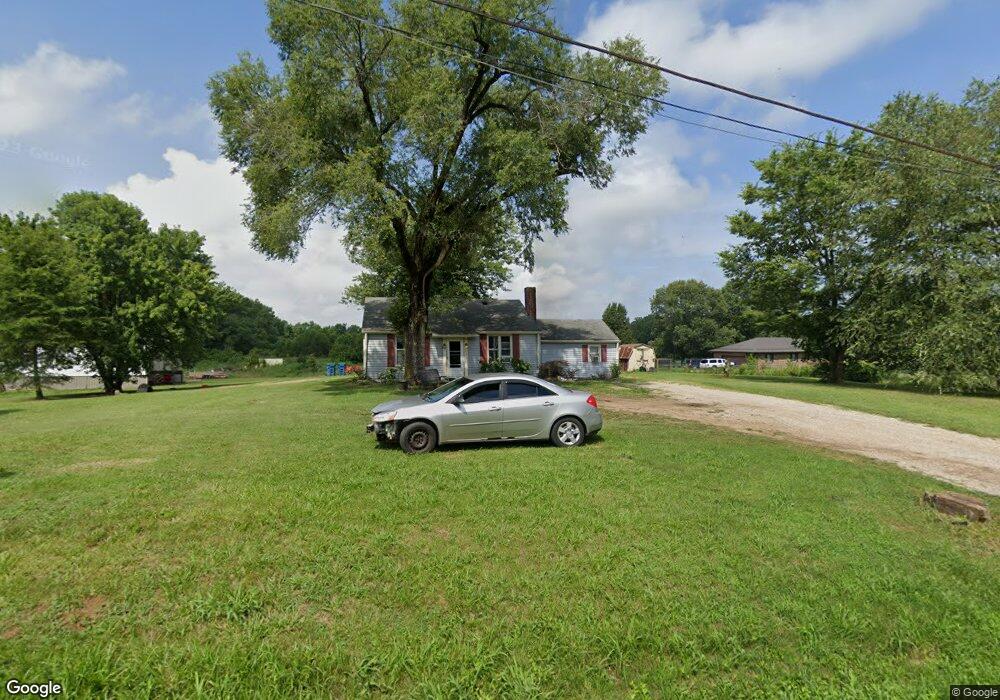
677 Inderrieden Rd Chandler, IN 47610
Estimated Value: $116,000 - $257,995
3
Beds
1
Bath
1,168
Sq Ft
$172/Sq Ft
Est. Value
About This Home
This home is located at 677 Inderrieden Rd, Chandler, IN 47610 and is currently estimated at $200,749, approximately $171 per square foot. 677 Inderrieden Rd is a home located in Warrick County with nearby schools including Chandler Elementary School, Castle North Middle School, and Boonville Middle School.
Ownership History
Date
Name
Owned For
Owner Type
Purchase Details
Closed on
Oct 31, 2023
Sold by
Apm Unlimited Llc
Bought by
Shourd Robert
Current Estimated Value
Purchase Details
Closed on
May 4, 2018
Sold by
Apm Unlimited
Bought by
Apm Unlimited Llc
Purchase Details
Closed on
Jun 23, 2010
Sold by
Moffett Jeff and Moffett Angie
Bought by
Apm Unlimited
Purchase Details
Closed on
Mar 25, 2010
Sold by
Gaultney Jack and Gaultney Sandy
Bought by
Moffett Jeff and Moffett Angela
Home Financials for this Owner
Home Financials are based on the most recent Mortgage that was taken out on this home.
Original Mortgage
$86,400
Interest Rate
5.03%
Mortgage Type
Purchase Money Mortgage
Purchase Details
Closed on
Dec 31, 2007
Sold by
Moffett Jeff Angle
Bought by
Moffett Jenn
Create a Home Valuation Report for This Property
The Home Valuation Report is an in-depth analysis detailing your home's value as well as a comparison with similar homes in the area
Home Values in the Area
Average Home Value in this Area
Purchase History
| Date | Buyer | Sale Price | Title Company |
|---|---|---|---|
| Shourd Robert | $110,000 | None Listed On Document | |
| Apm Unlimited Llc | -- | None Available | |
| Apm Unlimited | -- | None Available | |
| Moffett Jeff | -- | None Available | |
| Moffett Jenn | -- | None Available |
Source: Public Records
Mortgage History
| Date | Status | Borrower | Loan Amount |
|---|---|---|---|
| Previous Owner | Moffett Jeff | $86,400 |
Source: Public Records
Tax History Compared to Growth
Tax History
| Year | Tax Paid | Tax Assessment Tax Assessment Total Assessment is a certain percentage of the fair market value that is determined by local assessors to be the total taxable value of land and additions on the property. | Land | Improvement |
|---|---|---|---|---|
| 2024 | $2,610 | $182,000 | $54,800 | $127,200 |
| 2023 | $2,644 | $177,700 | $51,400 | $126,300 |
| 2022 | $2,063 | $141,400 | $26,800 | $114,600 |
| 2021 | $1,845 | $117,200 | $25,000 | $92,200 |
| 2020 | $1,921 | $115,100 | $24,400 | $90,700 |
| 2019 | $1,966 | $114,700 | $26,800 | $87,900 |
| 2018 | $1,858 | $113,400 | $27,300 | $86,100 |
| 2017 | $1,836 | $112,700 | $29,400 | $83,300 |
| 2016 | $1,840 | $113,600 | $30,400 | $83,200 |
| 2014 | $1,782 | $117,000 | $31,200 | $85,800 |
| 2013 | $1,540 | $103,400 | $28,600 | $74,800 |
Source: Public Records
Map
Nearby Homes
- 508 W Jefferson Ave
- 509 Inderrieden Rd
- 216 S Kentucky Ave
- 230 W Walnut St
- 817 N Illinois St
- 1054 Saddlebrooke Cir
- 1134 Saddlebrooke Cir
- 1214 Saddlebrooke Cir
- 326 Wabash Cir
- 521 E Monroe Ave
- 340 Wabash Cir
- 450 Mallard Cir
- 435 Mallard Cir
- 603 E Adams Ave
- 125 Cortez Ct
- 0 Gardner Rd
- 8100 Gardner Rd
- 1922 Hewins Rd
- 283 Baughs Ln
- 6855 Russell Place
- 520 Inderrieden Rd
- 521 W Adams Ave
- 516 W Monroe Ave
- 517 W Adams Ave
- 722 Inderrieden Rd
- 520 W Adams Ave
- 512 W Monroe Ave
- 521 W Monroe Ave
- 516 W Adams Ave
- 517 W Monroe Ave
- 520 W Madison Ave
- 508 W Monroe Ave
- 509 W Adams Ave
- 512 W Adams Ave
- 516 W Madison Ave
- 513 W Monroe Ave
- 508 W Adams Ave
- 504 W Monroe Ave
- 512 W Madison Ave
- 733 Inderrieden Rd