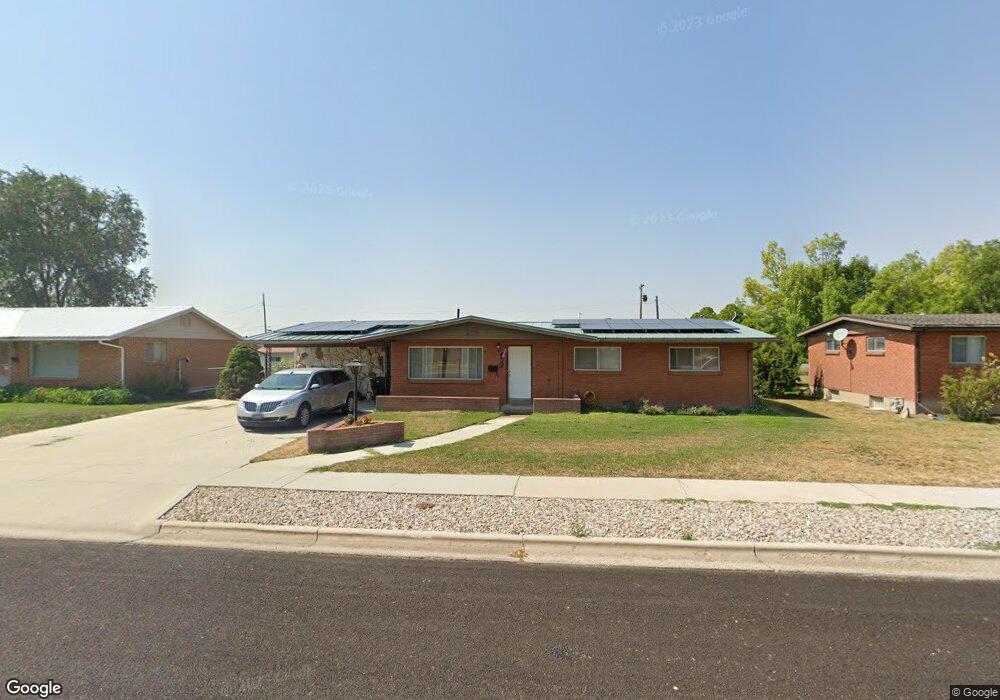
677 N 100 W Tremonton, UT 84337
Estimated Value: $386,855 - $406,000
3
Beds
2
Baths
1,732
Sq Ft
$229/Sq Ft
Est. Value
About This Home
This home is located at 677 N 100 W, Tremonton, UT 84337 and is currently estimated at $397,214, approximately $229 per square foot. 677 N 100 W is a home located in Box Elder County with nearby schools including North Park School, Alice C. Harris Intermediate School, and Bear River Middle School.
Ownership History
Date
Name
Owned For
Owner Type
Purchase Details
Closed on
Oct 13, 2020
Sold by
Green Mathew G
Bought by
Green Mathew G and Green Karen M
Current Estimated Value
Home Financials for this Owner
Home Financials are based on the most recent Mortgage that was taken out on this home.
Original Mortgage
$265,109
Outstanding Balance
$235,370
Interest Rate
2.8%
Mortgage Type
FHA
Estimated Equity
$161,844
Purchase Details
Closed on
Apr 27, 2016
Sold by
Miler James and Miller James
Bought by
Gundersen Hunter and Gundersen Taler
Home Financials for this Owner
Home Financials are based on the most recent Mortgage that was taken out on this home.
Original Mortgage
$139,393
Interest Rate
3.73%
Mortgage Type
New Conventional
Purchase Details
Closed on
Nov 16, 2007
Sold by
Stephens Carol Ann M
Bought by
Cronin Anthony and Cronin Lori Jo
Home Financials for this Owner
Home Financials are based on the most recent Mortgage that was taken out on this home.
Original Mortgage
$136,263
Interest Rate
6.36%
Mortgage Type
FHA
Create a Home Valuation Report for This Property
The Home Valuation Report is an in-depth analysis detailing your home's value as well as a comparison with similar homes in the area
Home Values in the Area
Average Home Value in this Area
Purchase History
| Date | Buyer | Sale Price | Title Company |
|---|---|---|---|
| Green Mathew G | -- | Cottonwood Ttl Ins Agcy Inc | |
| Green Mathew G | -- | Northern Title Company | |
| Gundersen Hunter | -- | Northern Title Company | |
| Cronin Anthony | -- | None Available |
Source: Public Records
Mortgage History
| Date | Status | Borrower | Loan Amount |
|---|---|---|---|
| Open | Green Mathew G | $265,109 | |
| Previous Owner | Gundersen Hunter | $139,393 | |
| Previous Owner | Cronin Anthony | $136,263 |
Source: Public Records
Tax History Compared to Growth
Tax History
| Year | Tax Paid | Tax Assessment Tax Assessment Total Assessment is a certain percentage of the fair market value that is determined by local assessors to be the total taxable value of land and additions on the property. | Land | Improvement |
|---|---|---|---|---|
| 2025 | $2,288 | $386,819 | $105,000 | $281,819 |
| 2024 | $2,288 | $388,017 | $105,000 | $283,017 |
| 2023 | $2,396 | $399,058 | $100,000 | $299,058 |
| 2022 | $2,003 | $190,160 | $16,500 | $173,660 |
| 2021 | $1,676 | $230,479 | $30,000 | $200,479 |
| 2020 | $1,524 | $230,479 | $30,000 | $200,479 |
| 2019 | $1,413 | $114,078 | $16,500 | $97,578 |
| 2018 | $831 | $62,346 | $13,750 | $48,596 |
| 2017 | $872 | $113,357 | $13,750 | $88,357 |
| 2016 | $860 | $60,033 | $13,750 | $46,283 |
| 2015 | $787 | $55,825 | $13,750 | $42,075 |
| 2014 | $787 | $53,821 | $13,750 | $40,071 |
| 2013 | -- | $53,822 | $13,338 | $40,484 |
Source: Public Records
Map
Nearby Homes
- 3 W 600 N
- 789 N 100 W
- 524 N 100 E
- 225 E 600 N
- 221 E 800 N
- 720 N 300 E
- 476 W 450 N
- 696 N 600 W Unit 105
- 688 N 600 W Unit 104
- 960 N 100 W
- 155 E 300 N
- 780 N 350 E
- Glendale Plan at Envision Estates - Tremonton
- Hawthorne Plan at Envision Estates - Tremonton
- Eucalyptus Plan at Envision Estates - Tremonton
- Hilldale Plan at Archibald Estates - Tremonton (Active Adult Homes)
- Hayden Plan at Envision Estates - Tremonton
- Hemlock Plan at Envision Estates - Tremonton
- Aberdeen Plan at Envision Estates - Tremonton
- Lyndhurst Plan at Envision Estates - Tremonton