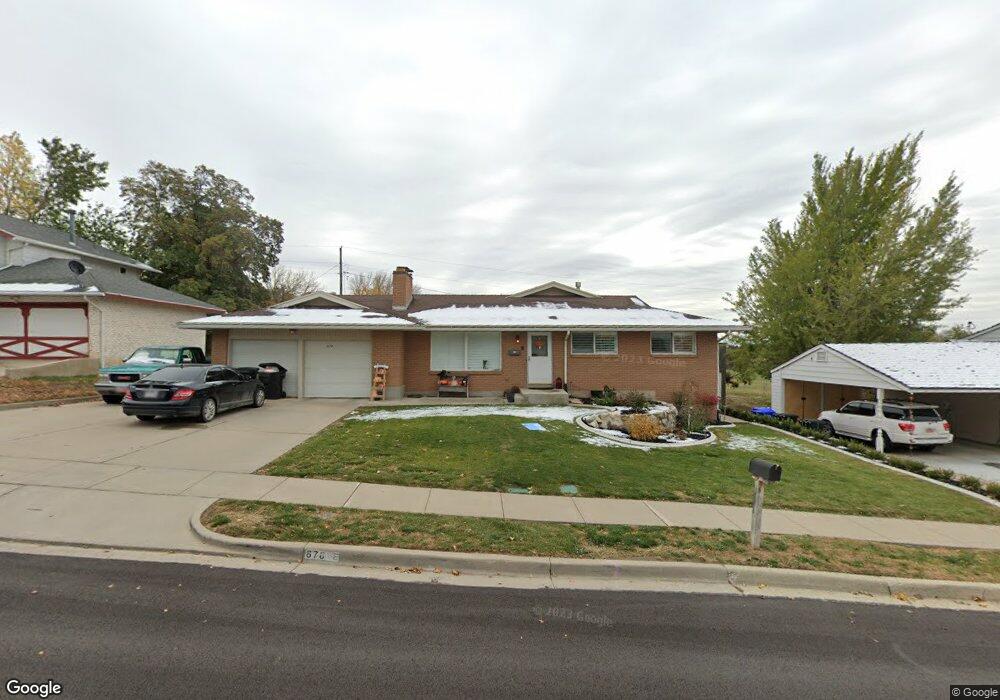
678 E 650 N Bountiful, UT 84010
Estimated Value: $609,000 - $715,860
5
Beds
3
Baths
3,736
Sq Ft
$178/Sq Ft
Est. Value
About This Home
This home is located at 678 E 650 N, Bountiful, UT 84010 and is currently estimated at $664,215, approximately $177 per square foot. 678 E 650 N is a home located in Davis County with nearby schools including Tolman School, Bountiful Junior High School, and Bountiful High School.
Ownership History
Date
Name
Owned For
Owner Type
Purchase Details
Closed on
Apr 23, 2019
Sold by
Noorde Hill Judy S
Bought by
Neslon Stephanie
Current Estimated Value
Home Financials for this Owner
Home Financials are based on the most recent Mortgage that was taken out on this home.
Original Mortgage
$276,000
Outstanding Balance
$242,653
Interest Rate
4.3%
Mortgage Type
New Conventional
Estimated Equity
$421,562
Purchase Details
Closed on
Jun 2, 2016
Sold by
Snarr Cosette H
Bought by
Noorda Hill Judy S
Purchase Details
Closed on
Feb 12, 1996
Sold by
Mcdaniel Carl C and Mcdaniel Miriam V
Bought by
Mcdaniel Carl C and Mcdaniel Miriam
Home Financials for this Owner
Home Financials are based on the most recent Mortgage that was taken out on this home.
Original Mortgage
$89,000
Interest Rate
6.99%
Create a Home Valuation Report for This Property
The Home Valuation Report is an in-depth analysis detailing your home's value as well as a comparison with similar homes in the area
Purchase History
| Date | Buyer | Sale Price | Title Company |
|---|---|---|---|
| Neslon Stephanie | -- | Vanguard Title Ins | |
| Noorda Hill Judy S | -- | Security Title | |
| Mcdaniel Carl C | -- | First American Title Co | |
| Mcdaniel Carl C | -- | First American Title Co |
Source: Public Records
Mortgage History
| Date | Status | Borrower | Loan Amount |
|---|---|---|---|
| Open | Neslon Stephanie | $276,000 | |
| Previous Owner | Mcdaniel Carl C | $89,000 |
Source: Public Records
Tax History
| Year | Tax Paid | Tax Assessment Tax Assessment Total Assessment is a certain percentage of the fair market value that is determined by local assessors to be the total taxable value of land and additions on the property. | Land | Improvement |
|---|---|---|---|---|
| 2025 | $3,885 | $359,150 | $130,096 | $229,054 |
| 2024 | $3,668 | $350,350 | $120,006 | $230,344 |
| 2023 | $3,512 | $608,000 | $216,839 | $391,161 |
| 2022 | $3,746 | $356,400 | $115,360 | $241,040 |
| 2021 | $3,406 | $496,000 | $171,394 | $324,606 |
| 2020 | $2,652 | $438,000 | $156,080 | $281,920 |
| 2019 | $2,692 | $382,000 | $155,429 | $226,571 |
| 2018 | $2,513 | $351,000 | $144,156 | $206,844 |
| 2016 | $2,224 | $168,465 | $45,356 | $123,109 |
| 2015 | $2,187 | $156,475 | $45,356 | $111,119 |
| 2014 | $2,022 | $148,135 | $45,356 | $102,779 |
| 2013 | -- | $128,109 | $43,945 | $84,164 |
Source: Public Records
Map
Nearby Homes
- 662 E 1200 N
- 1023 E 800 N
- 683 E 100 N
- 345 N 400 E
- 975 E 1050 N
- 453 N 400 E Unit 7-D
- 1105 E 600 N
- 908 Northern Hills Dr Unit 3
- 933 Northern Hills Cir
- 610 E Pages Ln
- 49 E 200 N Unit 4
- 41 E 200 N Unit 6
- 55 E 200 N Unit 2
- 51 E 200 N Unit 3
- 256 N Main St
- 254 N Main St
- 252 N Main St
- 1138 Briggs Dr
- 1342 Northridge Dr
- 1420 N Main St
Your Personal Tour Guide
Ask me questions while you tour the home.