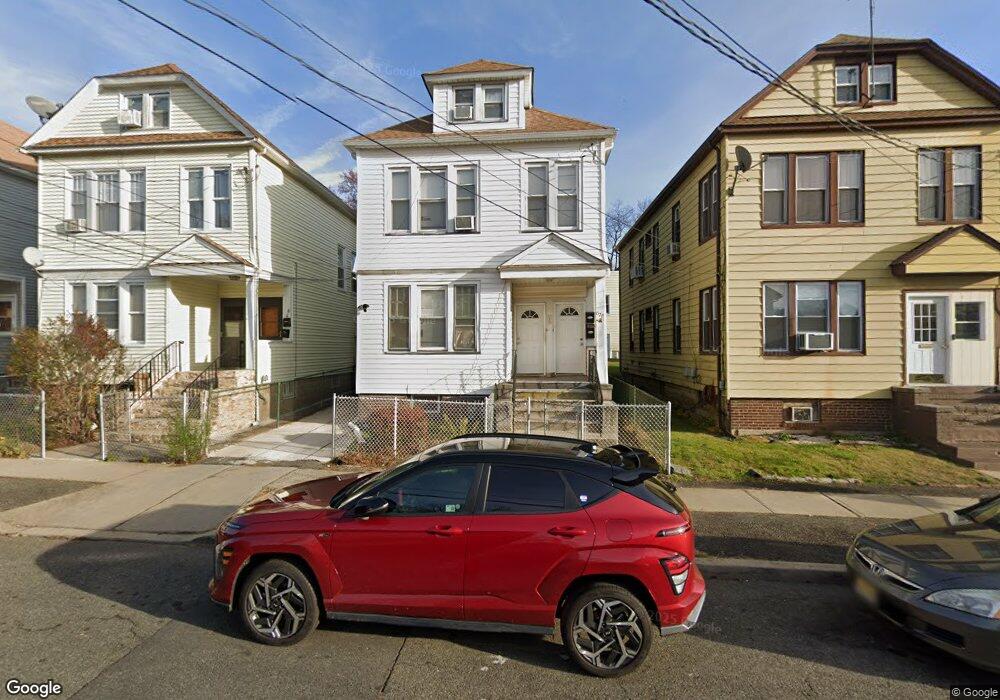
678 Langdon St Orange, NJ 07050
Estimated Value: $516,423 - $723,000
5
Beds
3
Baths
2,214
Sq Ft
$285/Sq Ft
Est. Value
About This Home
This home is located at 678 Langdon St, Orange, NJ 07050 and is currently estimated at $630,856, approximately $284 per square foot. 678 Langdon St is a home located in Essex County.
Ownership History
Date
Name
Owned For
Owner Type
Purchase Details
Closed on
Apr 29, 2020
Sold by
Descorbeth Joseph G
Bought by
Hill Lionel and Georges Marie M
Current Estimated Value
Home Financials for this Owner
Home Financials are based on the most recent Mortgage that was taken out on this home.
Original Mortgage
$343,660
Outstanding Balance
$306,335
Interest Rate
3.62%
Mortgage Type
FHA
Estimated Equity
$324,521
Purchase Details
Closed on
Nov 17, 2004
Sold by
Fuller Charmaine Gordon
Bought by
Abraham Marie
Home Financials for this Owner
Home Financials are based on the most recent Mortgage that was taken out on this home.
Original Mortgage
$189,000
Interest Rate
5.71%
Purchase Details
Closed on
Nov 29, 2001
Sold by
Elizabeth Yigzam
Bought by
Gordon Charmaine
Home Financials for this Owner
Home Financials are based on the most recent Mortgage that was taken out on this home.
Original Mortgage
$114,700
Interest Rate
7.04%
Create a Home Valuation Report for This Property
The Home Valuation Report is an in-depth analysis detailing your home's value as well as a comparison with similar homes in the area
Home Values in the Area
Average Home Value in this Area
Purchase History
| Date | Buyer | Sale Price | Title Company |
|---|---|---|---|
| Hill Lionel | $350,000 | Evident Title Agency Inc | |
| Abraham Marie | $210,000 | -- | |
| Gordon Charmaine | $116,500 | -- |
Source: Public Records
Mortgage History
| Date | Status | Borrower | Loan Amount |
|---|---|---|---|
| Open | Hill Lionel | $343,660 | |
| Previous Owner | Abraham Marie | $189,000 | |
| Previous Owner | Gordon Charmaine | $114,700 |
Source: Public Records
Tax History Compared to Growth
Tax History
| Year | Tax Paid | Tax Assessment Tax Assessment Total Assessment is a certain percentage of the fair market value that is determined by local assessors to be the total taxable value of land and additions on the property. | Land | Improvement |
|---|---|---|---|---|
| 2025 | $12,612 | $338,400 | $96,000 | $242,400 |
| 2024 | $12,612 | $338,400 | $96,000 | $242,400 |
| 2022 | $11,729 | $338,400 | $96,000 | $242,400 |
| 2021 | $10,843 | $187,600 | $45,000 | $142,600 |
| 2020 | $10,519 | $187,600 | $45,000 | $142,600 |
| 2019 | $9,971 | $187,600 | $45,000 | $142,600 |
| 2018 | $9,811 | $187,600 | $45,000 | $142,600 |
| 2017 | $9,136 | $187,600 | $45,000 | $142,600 |
| 2016 | $8,964 | $187,600 | $45,000 | $142,600 |
| 2015 | $8,729 | $187,600 | $45,000 | $142,600 |
| 2014 | $8,346 | $187,600 | $45,000 | $142,600 |
Source: Public Records
Map
Nearby Homes
- 669 Scotland Rd
- 669 Scotland Rd Unit 2
- 525 Argyle Ave
- 548 Tremont Ave
- 656 Scotland Rd
- 488 Heywood Ave
- 745 Valley St
- 567 Mcchesney St
- 585 Mcchesney St
- 549 Liberty St
- 7 Lawrence Ave
- 522 Vose Ave
- 527 Valley St
- 408 Heywood Ave
- 403 Lawnridge Rd
- 530 Lincoln Ave
- 403 Lawn Ridge Rd
- 421 Berwick St
- 409 Berwick St
- 360 Berwick St
- 674 Langdon St
- 680 Langdon St
- 684 Langdon St
- 672 Langdon St
- 543 Morris St
- 668 Langdon St
- 541 Morris St
- 666 Langdon St
- 561 Morris St
- 561 Morris St Unit 2
- 546 Chestnut St
- 546 Chestnut St Unit 1
- 537 Morris St
- 544 Chestnut St
- 662 Langdon St
- 671 Langdon St
- 540 Chestnut St
- 667 Langdon St
- 565 Morris St
- 538 Chestnut St