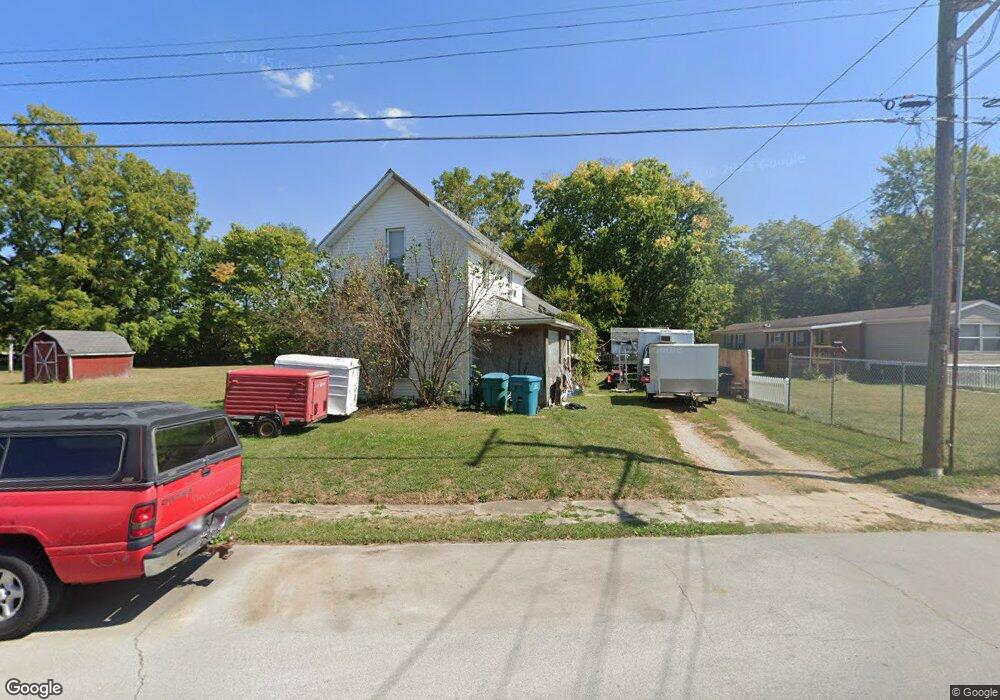
678 N Main St New Castle, IN 47362
Estimated Value: $97,000 - $118,239
3
Beds
1
Bath
1,104
Sq Ft
$98/Sq Ft
Est. Value
About This Home
This home is located at 678 N Main St, New Castle, IN 47362 and is currently estimated at $108,060, approximately $97 per square foot. 678 N Main St is a home located in Henry County with nearby schools including Agape Learning Center.
Ownership History
Date
Name
Owned For
Owner Type
Purchase Details
Closed on
Apr 27, 2018
Sold by
Masengale
Bought by
Niles Karl B
Current Estimated Value
Purchase Details
Closed on
Jun 4, 2012
Sold by
Masengale Janice I
Bought by
Masengale North Main Property Llc
Purchase Details
Closed on
Dec 10, 2009
Sold by
Masengale Larry G and Masengale Janice I
Bought by
Niles Karl B and Lao Niles Elizabeth M
Create a Home Valuation Report for This Property
The Home Valuation Report is an in-depth analysis detailing your home's value as well as a comparison with similar homes in the area
Home Values in the Area
Average Home Value in this Area
Purchase History
| Date | Buyer | Sale Price | Title Company |
|---|---|---|---|
| Niles Karl B | $40,000 | -- | |
| Niles Karl B | $40,000 | In Title Company | |
| Masengale North Main Property Llc | -- | None Available | |
| Niles Karl B | $40,000 | None Available |
Source: Public Records
Mortgage History
| Date | Status | Borrower | Loan Amount |
|---|---|---|---|
| Closed | Niles Karl B | $0 |
Source: Public Records
Tax History Compared to Growth
Tax History
| Year | Tax Paid | Tax Assessment Tax Assessment Total Assessment is a certain percentage of the fair market value that is determined by local assessors to be the total taxable value of land and additions on the property. | Land | Improvement |
|---|---|---|---|---|
| 2024 | $632 | $69,500 | $18,000 | $51,500 |
| 2023 | $604 | $67,600 | $18,000 | $49,600 |
| 2022 | $510 | $50,600 | $12,000 | $38,600 |
| 2021 | $480 | $47,600 | $12,000 | $35,600 |
| 2020 | $512 | $47,600 | $12,000 | $35,600 |
| 2019 | $537 | $46,800 | $12,000 | $34,800 |
| 2018 | $375 | $46,100 | $12,000 | $34,100 |
| 2017 | $347 | $45,400 | $12,000 | $33,400 |
| 2016 | $367 | $47,800 | $12,600 | $35,200 |
| 2014 | $271 | $44,700 | $12,600 | $32,100 |
| 2013 | $271 | $43,200 | $12,600 | $30,600 |
Source: Public Records
Map
Nearby Homes
- 711 N 14th St
- 1510 Michigan St
- 504 N 12th St
- 1506 Kentucky Ave
- 1324 Thornburg St
- 512 N 16th St
- 000 S St Rd 103
- 411 Luellen Way
- 321 N Main St
- 000 Wittenbraker Ave
- 922 Spring St
- 1707 Woodward Ave
- 420 N 20th St
- 404 N 20th St
- 709 Broad St
- 224 Reddingdale Dr
- 2311 Alabama St
- 1010 Church St
- 909 Church St
- 222 N 21st St