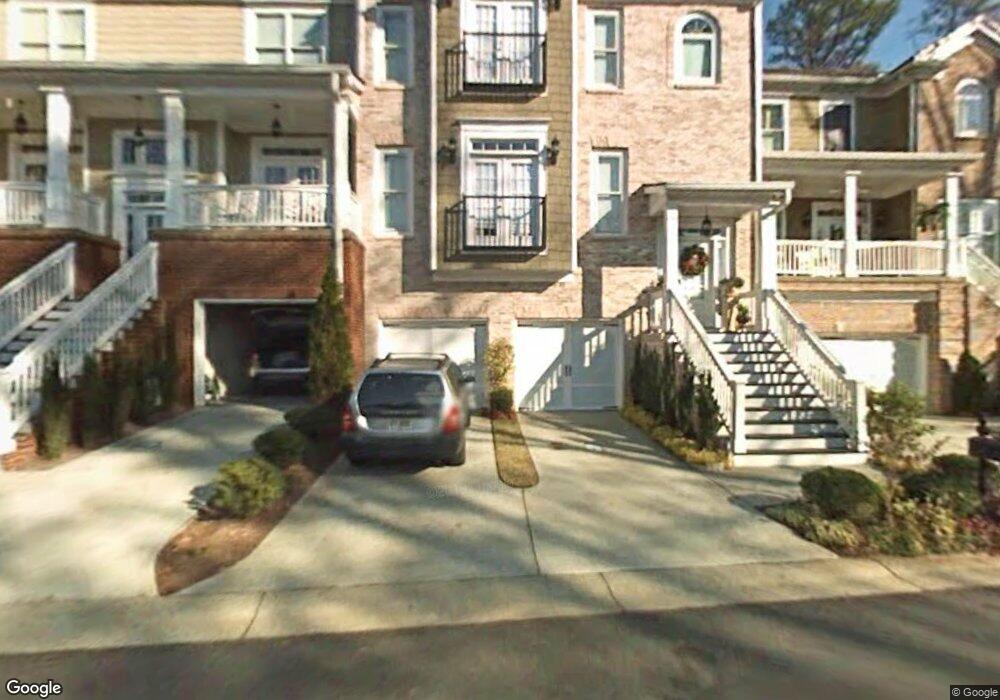
678 Royer Ct Unit 678 Atlanta, GA 30342
Sandy Springs ITP NeighborhoodEstimated Value: $524,591 - $961,000
3
Beds
3
Baths
2,298
Sq Ft
$308/Sq Ft
Est. Value
About This Home
This home is located at 678 Royer Ct Unit 678, Atlanta, GA 30342 and is currently estimated at $707,648, approximately $307 per square foot. 678 Royer Ct Unit 678 is a home located in Fulton County with nearby schools including High Point Elementary School, Ridgeview Charter School, and Riverwood International Charter School.
Ownership History
Date
Name
Owned For
Owner Type
Purchase Details
Closed on
Jul 29, 2016
Sold by
Tiberio P
Bought by
Dejulio Tiberio P and Dejulio Gayle G
Current Estimated Value
Home Financials for this Owner
Home Financials are based on the most recent Mortgage that was taken out on this home.
Original Mortgage
$375,200
Outstanding Balance
$299,366
Interest Rate
3.48%
Mortgage Type
VA
Estimated Equity
$408,282
Purchase Details
Closed on
Apr 29, 2013
Sold by
Eaves Samantha S
Bought by
Williams Sean A and Williams Sha-Naki Monique
Home Financials for this Owner
Home Financials are based on the most recent Mortgage that was taken out on this home.
Original Mortgage
$358,400
Interest Rate
3.59%
Mortgage Type
VA
Purchase Details
Closed on
Mar 14, 2012
Sold by
Cannata Krisanne M
Bought by
Eaves Samantha S
Home Financials for this Owner
Home Financials are based on the most recent Mortgage that was taken out on this home.
Original Mortgage
$295,000
Interest Rate
3.89%
Mortgage Type
VA
Purchase Details
Closed on
Nov 22, 2005
Sold by
Chesapeake Dev Inc
Bought by
Cannata Krisanne M
Create a Home Valuation Report for This Property
The Home Valuation Report is an in-depth analysis detailing your home's value as well as a comparison with similar homes in the area
Home Values in the Area
Average Home Value in this Area
Purchase History
| Date | Buyer | Sale Price | Title Company |
|---|---|---|---|
| Dejulio Tiberio P | -- | -- | |
| Dejulio Tiberio P | $478,000 | -- | |
| Williams Sean A | $350,000 | -- | |
| Eaves Samantha S | $295,000 | -- | |
| Cannata Krisanne M | $438,400 | -- |
Source: Public Records
Mortgage History
| Date | Status | Borrower | Loan Amount |
|---|---|---|---|
| Open | Dejulio Tiberio P | $375,200 | |
| Closed | Dejulio Tiberio P | $375,200 | |
| Previous Owner | Williams Sean A | $358,400 | |
| Previous Owner | Eaves Samantha S | $295,000 |
Source: Public Records
Tax History Compared to Growth
Tax History
| Year | Tax Paid | Tax Assessment Tax Assessment Total Assessment is a certain percentage of the fair market value that is determined by local assessors to be the total taxable value of land and additions on the property. | Land | Improvement |
|---|---|---|---|---|
| 2025 | $5,087 | $191,040 | $31,840 | $159,200 |
| 2023 | $5,400 | $191,320 | $31,840 | $159,480 |
| 2022 | $4,960 | $191,320 | $31,840 | $159,480 |
| 2021 | $4,917 | $185,760 | $30,920 | $154,840 |
| 2020 | $4,946 | $199,720 | $42,920 | $156,800 |
| 2019 | $4,862 | $196,160 | $42,160 | $154,000 |
| 2018 | $5,482 | $191,560 | $41,160 | $150,400 |
| 2017 | $5,011 | $160,160 | $47,320 | $112,840 |
| 2016 | $4,400 | $160,160 | $47,320 | $112,840 |
| 2015 | $4,035 | $140,000 | $41,360 | $98,640 |
| 2014 | $4,129 | $140,000 | $41,360 | $98,640 |
Source: Public Records
Map
Nearby Homes
- 5559 Glenridge Dr Unit 1309
- 610 Glenforest Rd NE
- 5795 Timberlane Terrace NE
- 68 Willow Glen NE
- 54 Willow Glen NE Unit 54
- 49 Willow Glen NE
- 440 Belada Blvd
- 45 Willow Glen NE
- 5211 Glenridge Dr NE
- 5641 Roswell Rd Unit 111
- 5641 Roswell Rd Unit 103
- 1000 Clementstone Dr NE
- 570 Belada Blvd
- 346 Carpenter Dr NE Unit 32
- 346 Carpenter Dr Unit 64
- 5400 Roswell Rd Unit H5
- 5400 Roswell Rd Unit K2
- 5400 Roswell Rd Unit 6
- 5400 Roswell Rd Unit L3
- 678 Royer Ct
- 688 Royer Ct
- 668 Royer Ct
- 698 Royer Ct
- 658 Royer Ct
- 0 Royer Ct
- 683 Royer Ct
- 663 Royer Ct
- 653 Royer Ct
- 653 Royer Ct Unit 653
- 643 Royer Ct
- 425 Winfield Glen Ct NE
- 415 Winfield Glen Ct NE
- 435 Winfield Glen Ct NE
- 5559 Glenridge Dr Unit 1104
- 5559 Glenridge Dr Unit 2408
- 5559 Glenridge Dr Unit 2105
- 5559 Glenridge Dr Unit 2206
- 5559 Glenridge Dr
- 5559 Glenridge Dr