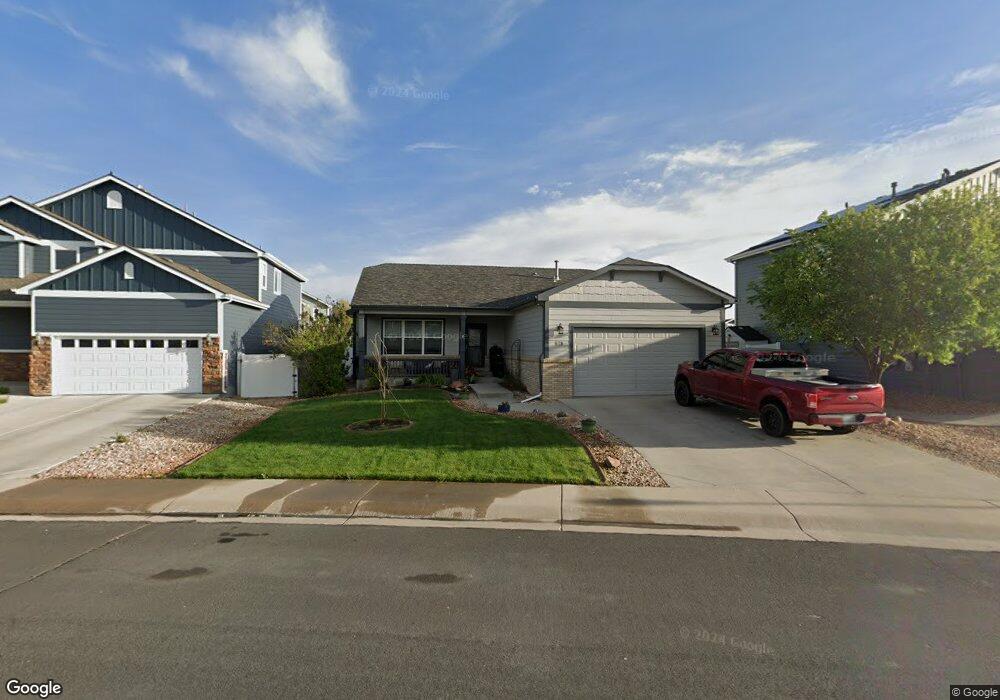
678 Shoshone Ct Windsor, CO 80550
Estimated Value: $488,007 - $596,000
3
Beds
2
Baths
1,469
Sq Ft
$372/Sq Ft
Est. Value
About This Home
This home is located at 678 Shoshone Ct, Windsor, CO 80550 and is currently estimated at $546,752, approximately $372 per square foot. 678 Shoshone Ct is a home located in Weld County with nearby schools including Severance Middle School, Windsor High School, and Windsor Charter Academy Elementary School.
Ownership History
Date
Name
Owned For
Owner Type
Purchase Details
Closed on
Feb 27, 2009
Sold by
Deutsche Bank National Trust Company
Bought by
Hansen Colby and Hansen Brooke
Current Estimated Value
Home Financials for this Owner
Home Financials are based on the most recent Mortgage that was taken out on this home.
Original Mortgage
$222,323
Outstanding Balance
$137,333
Interest Rate
4.92%
Mortgage Type
FHA
Estimated Equity
$409,419
Purchase Details
Closed on
Jan 8, 2009
Sold by
Irving Mary Kay
Bought by
Deutsche Bank National Trust Company
Home Financials for this Owner
Home Financials are based on the most recent Mortgage that was taken out on this home.
Original Mortgage
$222,323
Outstanding Balance
$137,333
Interest Rate
4.92%
Mortgage Type
FHA
Estimated Equity
$409,419
Purchase Details
Closed on
Apr 17, 2006
Sold by
Spring Creek Homes Llc
Bought by
Irving Mary Kay
Purchase Details
Closed on
Nov 23, 2005
Sold by
Winter Farm Windsor Llc
Bought by
Spring Creek Homes Llc
Create a Home Valuation Report for This Property
The Home Valuation Report is an in-depth analysis detailing your home's value as well as a comparison with similar homes in the area
Purchase History
| Date | Buyer | Sale Price | Title Company |
|---|---|---|---|
| Hansen Colby | $230,000 | Security Title | |
| Deutsche Bank National Trust Company | -- | None Available | |
| Irving Mary Kay | -- | None Available | |
| Spring Creek Homes Llc | $66,150 | -- |
Source: Public Records
Mortgage History
| Date | Status | Borrower | Loan Amount |
|---|---|---|---|
| Open | Hansen Colby | $222,323 |
Source: Public Records
Tax History
| Year | Tax Paid | Tax Assessment Tax Assessment Total Assessment is a certain percentage of the fair market value that is determined by local assessors to be the total taxable value of land and additions on the property. | Land | Improvement |
|---|---|---|---|---|
| 2025 | $3,932 | $31,760 | $7,500 | $24,260 |
| 2024 | $3,696 | $34,320 | $6,700 | $27,620 |
| 2023 | $3,696 | $34,650 | $6,770 | $27,880 |
| 2022 | $3,404 | $25,130 | $6,320 | $18,810 |
| 2021 | $3,267 | $25,860 | $6,510 | $19,350 |
| 2020 | $3,132 | $24,320 | $5,010 | $19,310 |
| 2019 | $3,134 | $24,320 | $5,010 | $19,310 |
| 2018 | $3,169 | $22,520 | $5,040 | $17,480 |
| 2017 | $3,241 | $22,520 | $5,040 | $17,480 |
| 2016 | $2,987 | $20,590 | $3,420 | $17,170 |
| 2015 | $2,855 | $20,590 | $3,420 | $17,170 |
| 2014 | $2,485 | $17,220 | $2,790 | $14,430 |
Source: Public Records
Map
Nearby Homes
- 633 Shoshone Ct
- 444 Stonebrook Dr
- 623 Vermilion Peak Dr
- 542 Cherryridge Dr
- 621 Denali Ct
- 901 Ashbrook Dr
- 447 Havenbrook Dr
- 586 Cherryridge Dr
- 597 Red Jewel Dr
- 679 Red Jewel Dr
- 355 Antora Ct
- 244 Veronica Dr
- 265 Hillspire Dr
- 848 Shirttail Peak Dr
- 18 Boxwood Dr
- 175 Boxwood Dr
- 77 Boxwood Dr
- 293 Turnberry Dr
- 283 Turnberry Dr
- 273 Turnberry Dr
- 682 Shoshone Ct
- 672 Shoshone Ct
- 523 Powderhorn Ct
- 503 Powderhorn Ct
- 688 Shoshone Ct
- 533 Powderhorn Ct
- 671 Shoshone Ct
- 681 Shoshone Ct
- 410 Saratoga Way
- 692 Shoshone Ct
- 420 Saratoga Way
- 687 Shoshone Ct
- 392 Saratoga Way
- 563 Powderhorn Ct
- 697 Shoshone Ct
- 345 Telluride Dr
- 341 Telluride Dr
- 524 Powderhorn Ct
- 691 Shoshone Ct
- 430 Saratoga Way
Your Personal Tour Guide
Ask me questions while you tour the home.