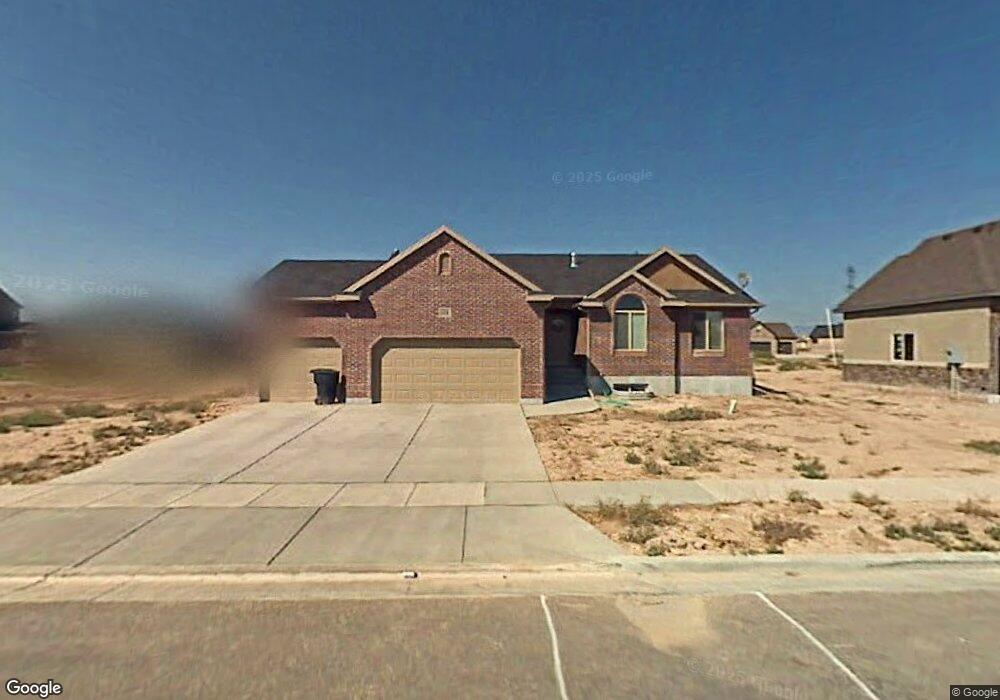
678 W 2010 S Syracuse, UT 84075
Estimated Value: $526,000 - $585,000
3
Beds
2
Baths
1,499
Sq Ft
$372/Sq Ft
Est. Value
About This Home
This home is located at 678 W 2010 S, Syracuse, UT 84075 and is currently estimated at $556,936, approximately $371 per square foot. 678 W 2010 S is a home located in Davis County with nearby schools including Bluff Ridge Elementary, Legacy Junior High School, and Clearfield High School.
Ownership History
Date
Name
Owned For
Owner Type
Purchase Details
Closed on
Mar 28, 2007
Sold by
Perry & Associates Inc
Bought by
Perry Homes Utah Inc
Current Estimated Value
Home Financials for this Owner
Home Financials are based on the most recent Mortgage that was taken out on this home.
Original Mortgage
$53,257
Outstanding Balance
$32,289
Interest Rate
6.29%
Mortgage Type
Stand Alone Second
Estimated Equity
$524,647
Purchase Details
Closed on
Mar 26, 2007
Sold by
Perry Homes Utah Inc
Bought by
Rydman Melissa D and Rydman Anthony D
Home Financials for this Owner
Home Financials are based on the most recent Mortgage that was taken out on this home.
Original Mortgage
$53,257
Outstanding Balance
$32,289
Interest Rate
6.29%
Mortgage Type
Stand Alone Second
Estimated Equity
$524,647
Create a Home Valuation Report for This Property
The Home Valuation Report is an in-depth analysis detailing your home's value as well as a comparison with similar homes in the area
Home Values in the Area
Average Home Value in this Area
Purchase History
| Date | Buyer | Sale Price | Title Company |
|---|---|---|---|
| Perry Homes Utah Inc | -- | Meridian Title Company | |
| Rydman Melissa D | -- | Meridian Title Company |
Source: Public Records
Mortgage History
| Date | Status | Borrower | Loan Amount |
|---|---|---|---|
| Open | Perry Homes Utah Inc | $53,257 | |
| Open | Rydman Melissa D | $213,028 |
Source: Public Records
Tax History Compared to Growth
Tax History
| Year | Tax Paid | Tax Assessment Tax Assessment Total Assessment is a certain percentage of the fair market value that is determined by local assessors to be the total taxable value of land and additions on the property. | Land | Improvement |
|---|---|---|---|---|
| 2025 | $2,942 | $283,800 | $120,741 | $163,059 |
| 2024 | $2,797 | $271,700 | $95,989 | $175,711 |
| 2023 | $2,706 | $479,000 | $133,967 | $345,033 |
| 2022 | $2,891 | $280,500 | $77,641 | $202,859 |
| 2021 | $2,490 | $374,000 | $114,301 | $259,699 |
| 2020 | $2,249 | $327,000 | $101,503 | $225,497 |
| 2019 | $2,201 | $316,000 | $96,856 | $219,144 |
| 2018 | $2,056 | $293,000 | $94,802 | $198,198 |
| 2016 | $1,904 | $142,285 | $36,474 | $105,811 |
| 2015 | $1,896 | $134,915 | $36,474 | $98,441 |
| 2014 | $1,835 | $133,058 | $36,474 | $96,584 |
| 2013 | -- | $122,751 | $32,907 | $89,844 |
Source: Public Records
Map
Nearby Homes
- 1913 S 525 W
- 877 W 1920 S Unit C
- 891 W 1920 S Unit C
- 891 W 1840 S Unit A
- 929 W 1920 S Unit A
- 992 W 1910 S
- 936 W 2225 S
- 904 W 2300 S
- 1079 W 2050 S
- 2232 S 1000 W
- 2236 S 300 W
- 1153 W 1875 S
- 1142 W 2050 S
- 1148 W 2050 S
- Everglade Plan at Wilcox Farms
- Echo Plan at Wilcox Farms
- Granite Plan at Wilcox Farms
- 1553 S 900 W
- 1553 S 900 W Unit 139
- 1622 S 1000 W