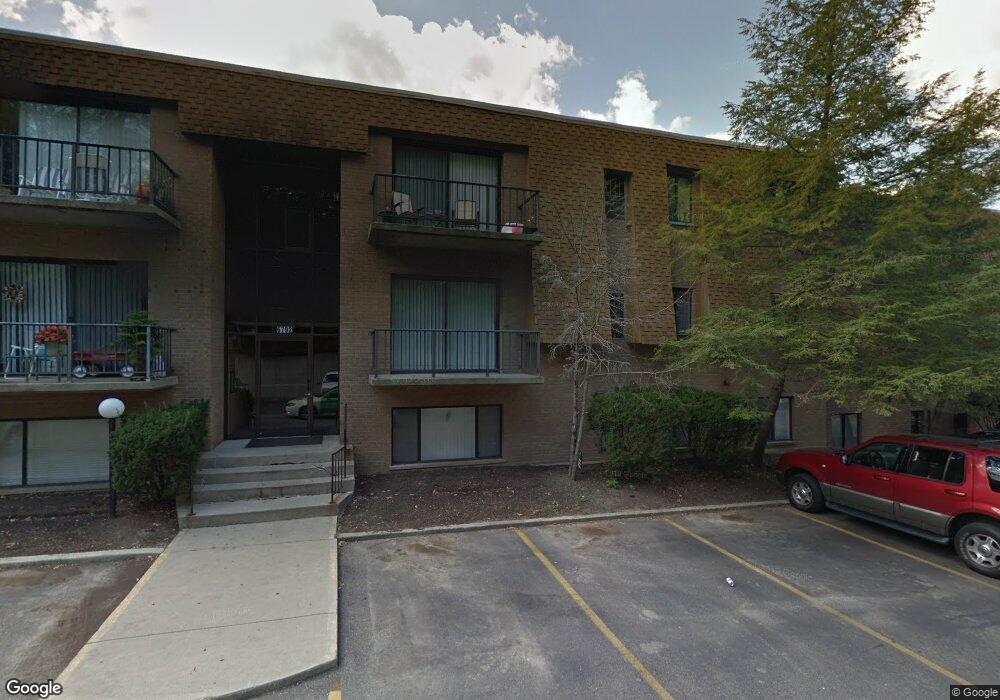
6780 Harrison Ave Unit 78 Cincinnati, OH 45247
Estimated Value: $89,000 - $117,436
2
Beds
2
Baths
840
Sq Ft
$117/Sq Ft
Est. Value
About This Home
This home is located at 6780 Harrison Ave Unit 78, Cincinnati, OH 45247 and is currently estimated at $98,109, approximately $116 per square foot. 6780 Harrison Ave Unit 78 is a home located in Hamilton County with nearby schools including Charles W Springmyer Elementary School, Bridgetown Middle School, and Oak Hills High School.
Ownership History
Date
Name
Owned For
Owner Type
Purchase Details
Closed on
Apr 3, 2019
Sold by
Greene Thomas and Greene Andrea
Bought by
Buckley Nicole E
Current Estimated Value
Purchase Details
Closed on
Jan 31, 2011
Sold by
Morris Heather M
Bought by
Greene Thomas and Greene Andrea Greene
Purchase Details
Closed on
Nov 10, 2006
Sold by
Wilson Gerald G
Bought by
Morris Heather M
Home Financials for this Owner
Home Financials are based on the most recent Mortgage that was taken out on this home.
Original Mortgage
$56,300
Interest Rate
6.33%
Mortgage Type
Purchase Money Mortgage
Purchase Details
Closed on
Feb 28, 2004
Sold by
Wetenkamp Douglas Allen
Bought by
Wilson Gerald G
Purchase Details
Closed on
Sep 2, 1999
Sold by
Wetenkamp Earl G and Wetenkamp Sue F
Bought by
Wetenkamp Douglas Allen
Create a Home Valuation Report for This Property
The Home Valuation Report is an in-depth analysis detailing your home's value as well as a comparison with similar homes in the area
Home Values in the Area
Average Home Value in this Area
Purchase History
| Date | Buyer | Sale Price | Title Company |
|---|---|---|---|
| Buckley Nicole E | $47,500 | None Available | |
| Greene Thomas | -- | Attorney | |
| Morris Heather M | $56,300 | Attorney | |
| Wilson Gerald G | $39,000 | Southeast Equity Title | |
| Wetenkamp Douglas Allen | -- | -- |
Source: Public Records
Mortgage History
| Date | Status | Borrower | Loan Amount |
|---|---|---|---|
| Previous Owner | Morris Heather M | $56,300 |
Source: Public Records
Tax History
| Year | Tax Paid | Tax Assessment Tax Assessment Total Assessment is a certain percentage of the fair market value that is determined by local assessors to be the total taxable value of land and additions on the property. | Land | Improvement |
|---|---|---|---|---|
| 2025 | $1,314 | $24,546 | $2,800 | $21,746 |
| 2023 | $1,294 | $24,546 | $2,800 | $21,746 |
| 2022 | $1,031 | $16,626 | $3,112 | $13,514 |
| 2021 | $948 | $16,626 | $3,112 | $13,514 |
| 2020 | $937 | $16,626 | $3,112 | $13,514 |
| 2019 | $718 | $11,536 | $2,450 | $9,086 |
| 2018 | $719 | $11,536 | $2,450 | $9,086 |
| 2017 | $685 | $11,536 | $2,450 | $9,086 |
| 2016 | $544 | $9,048 | $2,303 | $6,745 |
| 2015 | $542 | $9,048 | $2,303 | $6,745 |
| 2014 | $542 | $9,048 | $2,303 | $6,745 |
| 2013 | $540 | $9,625 | $2,450 | $7,175 |
Source: Public Records
Map
Nearby Homes
- 6780 Harrison Ave
- 6765 Verde Ridge Dr Unit 20C
- 5632 Sarahs Oak Dr
- 6864 Ruwes Oak Dr
- 5473 Michelles Oak Ct
- 7787 Skyview Cir
- 8060 Bridge Point Dr
- SHELBURN Plan at Janson Woods
- BRENNAN Plan at Janson Woods
- STRATTON Plan at Janson Woods
- QUENTIN Plan at Janson Woods
- VANDERBURGH Plan at Janson Woods
- BUCHANAN Plan at Janson Woods
- ASH LAWN Plan at Janson Woods
- ALDEN Plan at Janson Woods
- BENNETT Plan at Janson Woods
- LYNDHURST Plan at Janson Woods
- 7979 Oakbridge Way
- 8001 Oakbridge Way
- 8041 Oakbridge Way
- 6780 Harrison Ave Unit 74
- 6780 Harrison Ave Unit 75
- 6780 Harrison Ave
- 6780 Harrison Ave Unit 81
- 6780 Harrison Ave
- 6780 Harrison Ave
- 6780 Harrison Ave
- 6780 Harrison Ave
- 6780 Harrison Ave
- 6780 Harrison Ave Unit 77
- 6780 Harrison Ave
- 6780 Harrison Ave
- 6780 Harrison Ave Unit 79
- 6780 Harrison Ave Unit 82
- 6780 Harrison Ave Unit 73
- 6780 Harrison Ave Unit 80
- 6780 Harrison Ave Unit 83
- 6782 Harrison Ave Unit 87
- 6782 Harrison Ave Unit 90
- 6782 Harrison Ave Unit 89
Your Personal Tour Guide
Ask me questions while you tour the home.