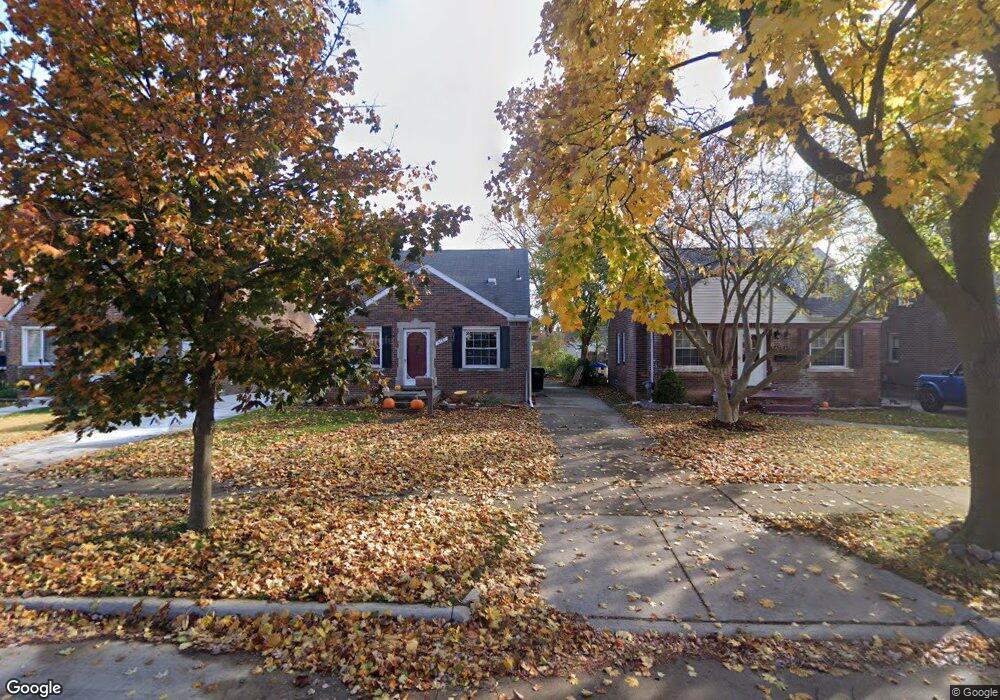
6781 Shenandoah Ave Unit Bldg-Unit Allen Park, MI 48101
Estimated Value: $161,000 - $207,000
--
Bed
1
Bath
1,062
Sq Ft
$177/Sq Ft
Est. Value
About This Home
This home is located at 6781 Shenandoah Ave Unit Bldg-Unit, Allen Park, MI 48101 and is currently estimated at $188,424, approximately $177 per square foot. 6781 Shenandoah Ave Unit Bldg-Unit is a home located in Wayne County with nearby schools including Bennie Elementary School, Allen Park Middle School, and Allen Park High School.
Ownership History
Date
Name
Owned For
Owner Type
Purchase Details
Closed on
Jun 14, 2021
Sold by
Tilk Edward
Bought by
Tilk Jacob W
Current Estimated Value
Home Financials for this Owner
Home Financials are based on the most recent Mortgage that was taken out on this home.
Original Mortgage
$108,000
Outstanding Balance
$97,781
Interest Rate
2.9%
Mortgage Type
New Conventional
Estimated Equity
$90,643
Purchase Details
Closed on
Sep 30, 2020
Sold by
Rickman Rebecca S
Bought by
Tilk Edward and Tilk Jacob W
Purchase Details
Closed on
Feb 27, 2018
Sold by
Mmc Homes Llc
Bought by
Rickman Rebecca J
Home Financials for this Owner
Home Financials are based on the most recent Mortgage that was taken out on this home.
Original Mortgage
$97,206
Interest Rate
4.62%
Mortgage Type
FHA
Purchase Details
Closed on
Oct 20, 2017
Sold by
Moore Judith Ann and Davidson Judith Ann
Bought by
Mmc Homes Llc
Create a Home Valuation Report for This Property
The Home Valuation Report is an in-depth analysis detailing your home's value as well as a comparison with similar homes in the area
Home Values in the Area
Average Home Value in this Area
Purchase History
| Date | Buyer | Sale Price | Title Company |
|---|---|---|---|
| Tilk Jacob W | -- | None Available | |
| Tilk Edward | $103,200 | None Available | |
| Rickman Rebecca J | $99,000 | Michigan Title Ins Agency In | |
| Mmc Homes Llc | -- | None Available |
Source: Public Records
Mortgage History
| Date | Status | Borrower | Loan Amount |
|---|---|---|---|
| Open | Tilk Jacob W | $108,000 | |
| Previous Owner | Rickman Rebecca J | $97,206 |
Source: Public Records
Tax History Compared to Growth
Tax History
| Year | Tax Paid | Tax Assessment Tax Assessment Total Assessment is a certain percentage of the fair market value that is determined by local assessors to be the total taxable value of land and additions on the property. | Land | Improvement |
|---|---|---|---|---|
| 2025 | $3,197 | $81,800 | $0 | $0 |
| 2024 | $3,197 | $78,400 | $0 | $0 |
| 2023 | $3,055 | $72,400 | $0 | $0 |
| 2022 | $3,658 | $63,900 | $0 | $0 |
| 2021 | $3,558 | $58,800 | $0 | $0 |
| 2020 | $3,045 | $51,900 | $0 | $0 |
| 2019 | $3,022 | $49,300 | $0 | $0 |
| 2018 | $2,364 | $46,900 | $0 | $0 |
| 2017 | $919 | $46,400 | $0 | $0 |
| 2016 | $2,336 | $43,400 | $0 | $0 |
| 2015 | $3,685 | $40,100 | $0 | $0 |
| 2013 | $3,570 | $38,600 | $0 | $0 |
| 2012 | $2,049 | $37,400 | $12,600 | $24,800 |
Source: Public Records
Map
Nearby Homes
- 6642 Shenandoah Ave
- 7140 Luana Ave
- 16546 Philomene Blvd
- 6587 Cortland Ave
- 7221 Winona Ave
- 6505 Kolb Ave
- 7639 Cortland Ave
- 15777 Mclain Ave
- 7668 Cortland Ave
- 7510 Balfour Ave
- 6345 Kolb Ave
- 7210 Buckingham Ave
- 15591 Garfield Ave
- 16050 Beatrice Ave
- 8027 Kolb Ave
- 6027 Kim Ave
- 16040 Beatrice Ave
- 15720 Jonas Ave
- 6789 Ziegler St
- 15570 Angelique Ave
- 6781 Shenandoah Ave
- 6787 Shenandoah Ave
- 6773 Shenandoah Ave
- 6765 Shenandoah Ave
- 6797 Shenandoah Ave
- 6757 Shenandoah Ave
- 6805 Shenandoah Ave
- 6780 Luana Ave
- 6788 Luana Ave
- 6774 Luana Ave
- 6764 Luana Ave
- 6815 Shenandoah Ave
- 6749 Shenandoah Ave
- 6796 Luana Ave
- 6780 Shenandoah Ave
- 6756 Luana Ave
- 6786 Shenandoah Ave
- 6772 Shenandoah Ave
- 6764 Shenandoah Ave
- 6794 Shenandoah Ave