6784 N Star Rd Ferndale, WA 98248
Estimated Value: $682,251 - $786,000
3
Beds
2
Baths
1,516
Sq Ft
$486/Sq Ft
Est. Value
About This Home
This home is located at 6784 N Star Rd, Ferndale, WA 98248 and is currently estimated at $736,313, approximately $485 per square foot. 6784 N Star Rd is a home located in Whatcom County with nearby schools including Custer Elementary School, Horizon Middle School, and Ferndale High School.
Ownership History
Date
Name
Owned For
Owner Type
Purchase Details
Closed on
Mar 19, 2013
Sold by
Fannie Mae
Bought by
Byma Michael and Byma Magali
Current Estimated Value
Home Financials for this Owner
Home Financials are based on the most recent Mortgage that was taken out on this home.
Original Mortgage
$226,697
Outstanding Balance
$159,684
Interest Rate
3.5%
Mortgage Type
FHA
Estimated Equity
$576,629
Purchase Details
Closed on
Nov 16, 2012
Sold by
Holyfield Craig Thomas
Bought by
Federal National Mortgage Association
Purchase Details
Closed on
Oct 29, 2003
Sold by
Bailey Susan E
Bought by
Holyfield Craig Thomas
Home Financials for this Owner
Home Financials are based on the most recent Mortgage that was taken out on this home.
Original Mortgage
$154,400
Interest Rate
5.65%
Mortgage Type
Purchase Money Mortgage
Create a Home Valuation Report for This Property
The Home Valuation Report is an in-depth analysis detailing your home's value as well as a comparison with similar homes in the area
Home Values in the Area
Average Home Value in this Area
Purchase History
| Date | Buyer | Sale Price | Title Company |
|---|---|---|---|
| Byma Michael | -- | Chicago Title Insurance | |
| Federal National Mortgage Association | $243,750 | First American Title Ins | |
| Holyfield Craig Thomas | $166,323 | Stewart Title Company |
Source: Public Records
Mortgage History
| Date | Status | Borrower | Loan Amount |
|---|---|---|---|
| Open | Byma Michael | $226,697 | |
| Previous Owner | Holyfield Craig Thomas | $154,400 | |
| Closed | Holyfield Craig Thomas | $38,600 |
Source: Public Records
Tax History Compared to Growth
Tax History
| Year | Tax Paid | Tax Assessment Tax Assessment Total Assessment is a certain percentage of the fair market value that is determined by local assessors to be the total taxable value of land and additions on the property. | Land | Improvement |
|---|---|---|---|---|
| 2024 | $4,477 | $617,901 | $207,760 | $410,141 |
| 2023 | $4,477 | $617,901 | $207,760 | $410,141 |
| 2022 | $3,872 | $551,697 | $185,500 | $366,197 |
| 2021 | $3,577 | $409,168 | $158,752 | $250,416 |
| 2020 | $3,640 | $346,753 | $134,536 | $212,217 |
| 2019 | $3,012 | $319,582 | $123,994 | $195,588 |
| 2018 | $3,369 | $301,468 | $116,966 | $184,502 |
| 2017 | $3,156 | $258,771 | $100,400 | $158,371 |
| 2016 | $2,568 | $258,771 | $100,400 | $158,371 |
| 2015 | $2,636 | $208,591 | $103,230 | $105,361 |
| 2014 | -- | $208,591 | $103,230 | $105,361 |
| 2013 | -- | $208,591 | $103,230 | $105,361 |
Source: Public Records
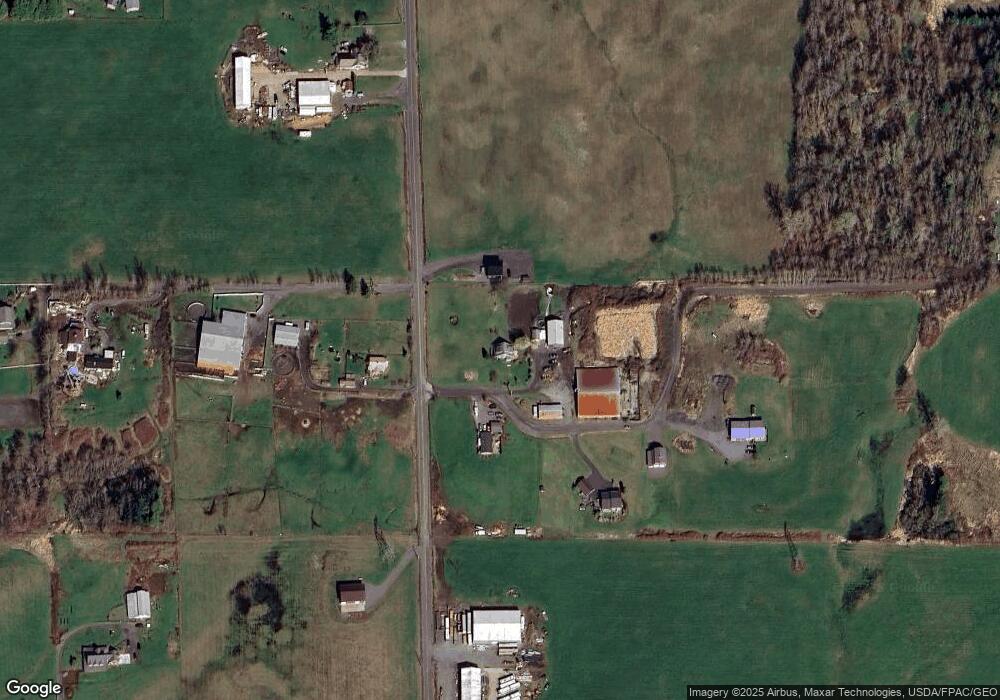
Map
Nearby Homes
- 3324 Bailey Way
- 6729 Hawk Ridge Dr
- 6379 Elder Rd
- 0 Valley View Lot 2 Rd Unit NWM2208210
- 3883 Everett Ln
- 0 Grandview Rd Unit NWM2386341
- 6152 Garrett Ln
- 7135 W 40th Dr
- 7125 Kickerville Rd
- 7245 Kickerville Rd
- 6241 Olson Rd
- 2751 Aldergrove Rd
- 0 XX Olson Rd
- 4230 Bay Rd
- 3027 Main St
- 2646 Lochcarron Dr
- 2948 Arnie Rd
- 6072 Monument Dr
- 7136 Portal Way Unit 18
- 6041 Brian Ct
- 3480 Bailey Way
- 6790 N Star Rd
- 6781 N Star Rd
- 3485 Bailey Way
- 3475 Bailey Way
- 3537 Saddleback Rd
- 3449 Bailey Way
- 6843 N Star Rd
- 3563 Saddleback Rd
- 6704 N Star Rd
- 3585 Saddleback Rd
- 6694 N Star Rd
- 3590 Brown Rd
- 3561 Grandview Rd
- 6685 N Star Rd
- 3384 Bailey Way
- 3523 Brown Rd
- 3531 Grandview Rd
- 3537 Brown Rd
- 3410 Grandview Rd