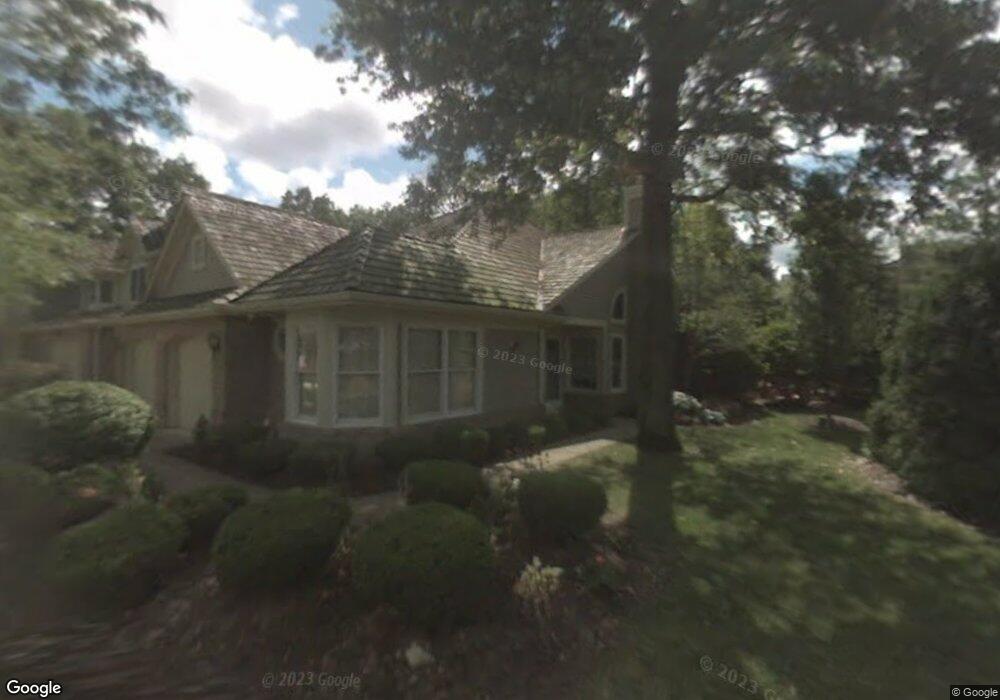
679 Brick Mill Run Unit B7 Westlake, OH 44145
Estimated Value: $247,000 - $381,000
2
Beds
2
Baths
1,561
Sq Ft
$195/Sq Ft
Est. Value
About This Home
This home is located at 679 Brick Mill Run Unit B7, Westlake, OH 44145 and is currently estimated at $304,890, approximately $195 per square foot. 679 Brick Mill Run Unit B7 is a home located in Cuyahoga County with nearby schools including Westlake Elementary School, Dover Intermediate School, and Lee Burneson Middle School.
Ownership History
Date
Name
Owned For
Owner Type
Purchase Details
Closed on
Sep 9, 2019
Sold by
Mcallister Ralph A and Mcallister Rosemary
Bought by
Gardner Robert W and Gardner Diane S
Current Estimated Value
Home Financials for this Owner
Home Financials are based on the most recent Mortgage that was taken out on this home.
Original Mortgage
$55,000
Outstanding Balance
$48,458
Interest Rate
3.89%
Mortgage Type
Adjustable Rate Mortgage/ARM
Estimated Equity
$256,432
Purchase Details
Closed on
Dec 26, 2018
Sold by
Mcallister Ralph A and Mcallister Rosemary
Bought by
Mcallister Ralph A and Mcallister Rosemary
Purchase Details
Closed on
Apr 28, 2006
Sold by
Blind Susan L
Bought by
Mcallister Ralph A and Mcallister Rosemary
Purchase Details
Closed on
Jan 22, 2001
Sold by
Heerd Ardis L
Bought by
Heerd Ardis L and John R Heerd Family Trust
Purchase Details
Closed on
Aug 10, 1992
Bought by
Heerd John R
Purchase Details
Closed on
Jan 1, 1991
Bought by
King James North Co
Create a Home Valuation Report for This Property
The Home Valuation Report is an in-depth analysis detailing your home's value as well as a comparison with similar homes in the area
Home Values in the Area
Average Home Value in this Area
Purchase History
| Date | Buyer | Sale Price | Title Company |
|---|---|---|---|
| Gardner Robert W | $233,000 | None Available | |
| Mcallister Ralph A | -- | None Available | |
| Mcallister Ralph A | $235,500 | City Title Agency | |
| Heerd Ardis L | -- | -- | |
| Heerd John R | $190,900 | -- | |
| King James North Co | -- | -- |
Source: Public Records
Mortgage History
| Date | Status | Borrower | Loan Amount |
|---|---|---|---|
| Open | Gardner Robert W | $55,000 |
Source: Public Records
Tax History Compared to Growth
Tax History
| Year | Tax Paid | Tax Assessment Tax Assessment Total Assessment is a certain percentage of the fair market value that is determined by local assessors to be the total taxable value of land and additions on the property. | Land | Improvement |
|---|---|---|---|---|
| 2024 | $3,399 | $81,550 | $12,530 | $69,020 |
| 2023 | $3,619 | $74,490 | $7,460 | $67,030 |
| 2022 | $3,584 | $74,480 | $7,460 | $67,030 |
| 2021 | $3,589 | $74,480 | $7,460 | $67,030 |
| 2020 | $2,889 | $57,300 | $5,740 | $51,560 |
| 2019 | $2,802 | $163,700 | $16,400 | $147,300 |
| 2018 | $1,407 | $57,300 | $5,740 | $51,560 |
| 2017 | $2,709 | $52,710 | $5,250 | $47,460 |
| 2016 | $2,695 | $52,710 | $5,250 | $47,460 |
| 2015 | $3,373 | $52,710 | $5,250 | $47,460 |
| 2014 | $3,373 | $62,760 | $6,270 | $56,490 |
Source: Public Records
Map
Nearby Homes
- 851 Brick Mill Run Unit 10
- 700 Brick Mill Run Unit 406
- 22576 Peach Tree Ln
- 7 Pond Dr
- 1330 E Melrose Dr
- 1301 Clague Rd
- 22722 Lake Rd
- 22728 Lake Rd
- 22700 Lake Rd Unit 204
- 22700 Lake Rd Unit 305
- 22700 Lake Rd Unit 406
- 22700 Lake Rd Unit 306
- 22700 Lake Rd Unit 405
- 22700 Lake Rd Unit 304
- 22700 Lake Rd Unit 504
- 22700 Lake Rd Unit 102
- 23200 Lake Rd Unit 50
- 23200 Lake Rd Unit 47
- 23200 Lake Rd Unit 30
- 1055 Medfield Dr
- 777 Brick Mill Run Unit 6
- 671 Brick Mill Run Unit C9
- 667 Brick Mill Run Unit D10
- 785 Brick Mill Run
- 785 Brick Mill Run Unit 4
- 671 Brick Mill Run Unit 9
- 789 Brick Mill Run Unit 3
- 793 Brick Mill Run Unit D2
- 789 Brick Mill Run Unit C1
- 781 Brick Mill Run
- 797 Brick Mill Run
- 797 Brick Mill Run Unit 1
- 663 Brick Mill Run
- 675 Brick Mill Run
- 22676 Locust Ln
- 22677 Locust Ln
- 676 Brick Mill Run
- 684 Brick Mill Run Unit C3
- 688 Brick Mill Run
- 678 Brick Mill Run Unit B2