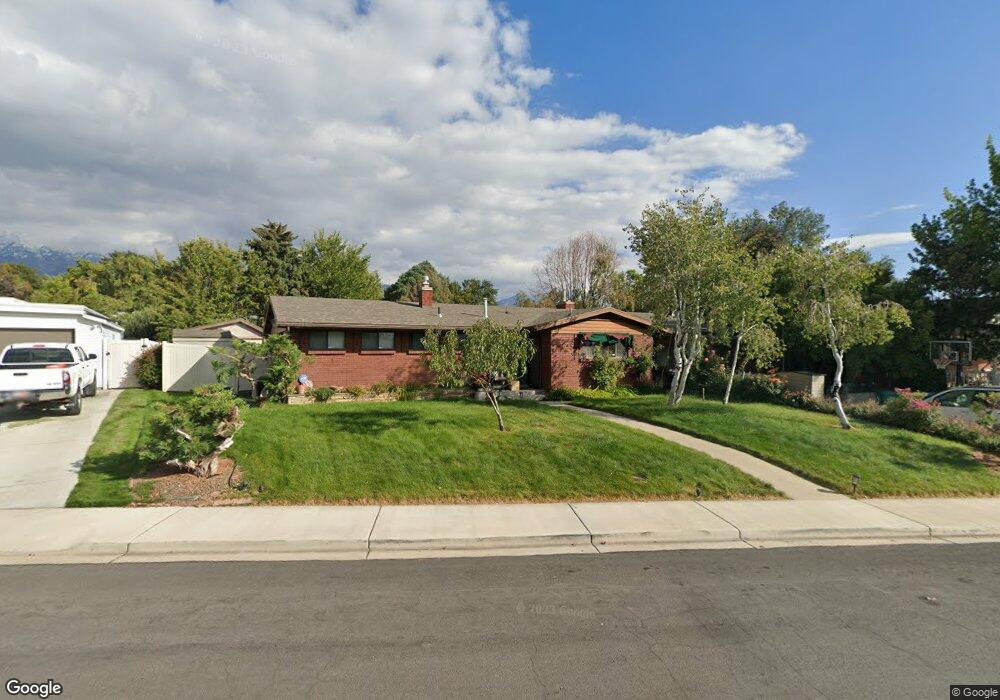
679 Cherry Dr Orem, UT 84058
Sunset Heights NeighborhoodEstimated Value: $470,207 - $504,000
3
Beds
2
Baths
2,126
Sq Ft
$229/Sq Ft
Est. Value
About This Home
This home is located at 679 Cherry Dr, Orem, UT 84058 and is currently estimated at $487,736, approximately $229 per square foot. 679 Cherry Dr is a home located in Utah County with nearby schools including Orem Elementary School, Lakeridge Jr High School, and Mountain View High School.
Ownership History
Date
Name
Owned For
Owner Type
Purchase Details
Closed on
Oct 12, 2015
Sold by
Jones Patricia L and Jones Ronald C
Bought by
Tripp Patricia L
Current Estimated Value
Purchase Details
Closed on
Mar 25, 2003
Sold by
Jones Patricia L
Bought by
Jones Patricia L and Jones Ronald C
Home Financials for this Owner
Home Financials are based on the most recent Mortgage that was taken out on this home.
Original Mortgage
$105,000
Interest Rate
5.79%
Purchase Details
Closed on
Mar 24, 2003
Sold by
Robinson Charles H and Malia Robinson C
Bought by
Jones Patricia L
Home Financials for this Owner
Home Financials are based on the most recent Mortgage that was taken out on this home.
Original Mortgage
$105,000
Interest Rate
5.79%
Create a Home Valuation Report for This Property
The Home Valuation Report is an in-depth analysis detailing your home's value as well as a comparison with similar homes in the area
Home Values in the Area
Average Home Value in this Area
Purchase History
| Date | Buyer | Sale Price | Title Company |
|---|---|---|---|
| Tripp Patricia L | -- | None Available | |
| Jones Patricia L | -- | -- | |
| Jones Patricia L | -- | -- |
Source: Public Records
Mortgage History
| Date | Status | Borrower | Loan Amount |
|---|---|---|---|
| Previous Owner | Jones Patricia L | $105,000 |
Source: Public Records
Tax History
| Year | Tax Paid | Tax Assessment Tax Assessment Total Assessment is a certain percentage of the fair market value that is determined by local assessors to be the total taxable value of land and additions on the property. | Land | Improvement |
|---|---|---|---|---|
| 2025 | $1,795 | $227,755 | -- | -- |
| 2024 | $1,795 | $219,505 | $0 | $0 |
| 2023 | $1,682 | $221,100 | $0 | $0 |
| 2022 | $1,738 | $221,265 | $0 | $0 |
| 2021 | $1,615 | $311,500 | $178,100 | $133,400 |
| 2020 | $1,442 | $273,300 | $142,500 | $130,800 |
| 2019 | $1,331 | $262,300 | $131,500 | $130,800 |
| 2018 | $1,247 | $234,800 | $113,200 | $121,600 |
| 2017 | $1,181 | $119,130 | $0 | $0 |
| 2016 | $1,102 | $102,465 | $0 | $0 |
| 2015 | $1,165 | $102,465 | $0 | $0 |
| 2014 | $1,151 | $100,815 | $0 | $0 |
Source: Public Records
Map
Nearby Homes
- 881 S 635 W
- 570 S 800 West St Unit 15
- 520 S 800 W Unit 14
- 506 S 800 West St Unit 13
- 308 W 730 S
- 1041 W 600 S
- 935 W 360 S
- 193 W 530 S
- 217 W 900 S
- 365 S 1015 W
- 216 S 400 W
- 1700 S Sandhill Rd Unit F401
- 237 S Ridgeview Dr
- 148 S 400 W
- 510 S 20 E
- 55 Hanover Dr
- 302 W 100 S
- 278 S 1160 W
- 842 S 50 E
- 64 S 320 W
Your Personal Tour Guide
Ask me questions while you tour the home.