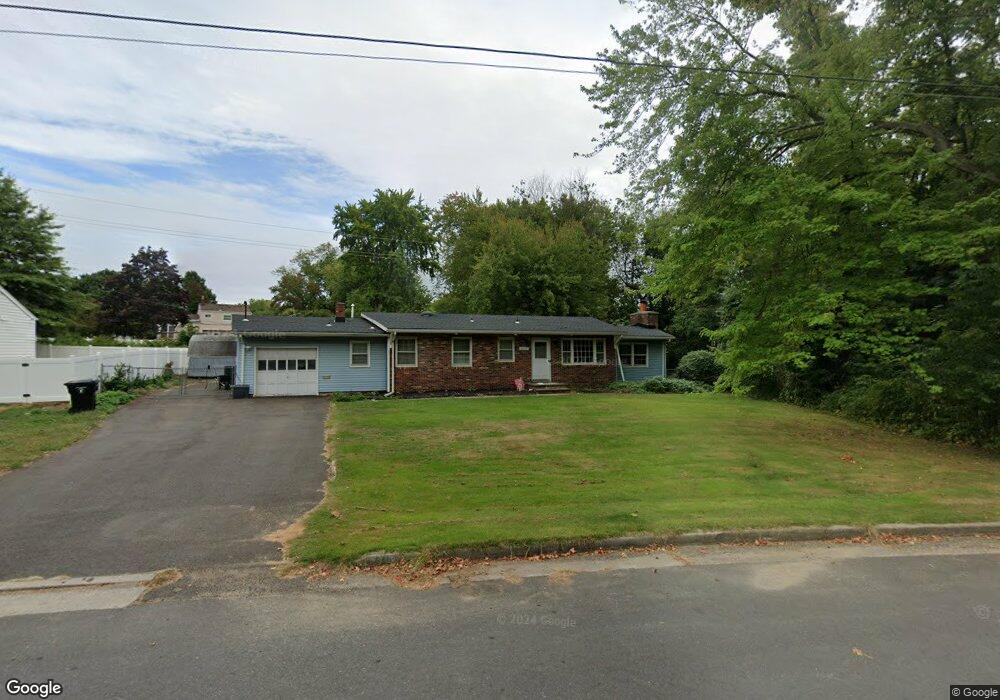
679 Hopping Rd Belford, NJ 07718
New Monmouth NeighborhoodEstimated Value: $524,000 - $640,000
3
Beds
2
Baths
1,480
Sq Ft
$405/Sq Ft
Est. Value
About This Home
This home is located at 679 Hopping Rd, Belford, NJ 07718 and is currently estimated at $599,556, approximately $405 per square foot. 679 Hopping Rd is a home located in Monmouth County with nearby schools including Bayview Elementary School, Bayshore Middle School, and Middletown High School North.
Ownership History
Date
Name
Owned For
Owner Type
Purchase Details
Closed on
Apr 22, 2004
Sold by
Wolf Jaems
Bought by
Mccabe John
Current Estimated Value
Home Financials for this Owner
Home Financials are based on the most recent Mortgage that was taken out on this home.
Original Mortgage
$255,900
Outstanding Balance
$118,825
Interest Rate
5.47%
Estimated Equity
$480,731
Purchase Details
Closed on
Aug 15, 1997
Sold by
Seo Anna
Bought by
Wolf James
Home Financials for this Owner
Home Financials are based on the most recent Mortgage that was taken out on this home.
Original Mortgage
$146,000
Interest Rate
7.42%
Create a Home Valuation Report for This Property
The Home Valuation Report is an in-depth analysis detailing your home's value as well as a comparison with similar homes in the area
Home Values in the Area
Average Home Value in this Area
Purchase History
| Date | Buyer | Sale Price | Title Company |
|---|---|---|---|
| Mccabe John | $319,900 | -- | |
| Wolf James | $156,000 | -- |
Source: Public Records
Mortgage History
| Date | Status | Borrower | Loan Amount |
|---|---|---|---|
| Open | Mccabe John | $255,900 | |
| Previous Owner | Wolf James | $146,000 |
Source: Public Records
Tax History Compared to Growth
Tax History
| Year | Tax Paid | Tax Assessment Tax Assessment Total Assessment is a certain percentage of the fair market value that is determined by local assessors to be the total taxable value of land and additions on the property. | Land | Improvement |
|---|---|---|---|---|
| 2025 | $6,817 | $489,400 | $344,700 | $144,700 |
| 2024 | $7,082 | $414,400 | $272,300 | $142,100 |
| 2023 | $7,082 | $407,500 | $268,700 | $138,800 |
| 2022 | $6,371 | $373,500 | $229,300 | $144,200 |
| 2021 | $6,371 | $306,300 | $178,000 | $128,300 |
| 2020 | $6,576 | $307,600 | $182,200 | $125,400 |
| 2019 | $6,758 | $320,000 | $182,200 | $137,800 |
| 2018 | $6,386 | $294,700 | $163,300 | $131,400 |
| 2017 | $6,407 | $292,700 | $163,300 | $129,400 |
| 2016 | $5,922 | $277,900 | $154,800 | $123,100 |
| 2015 | $6,116 | $277,100 | $154,800 | $122,300 |
| 2014 | $6,033 | $266,600 | $154,800 | $111,800 |
Source: Public Records
Map
Nearby Homes
- 675 Hopping Rd
- 683 Hopping Rd
- 676 Hopping Rd
- 673 Hopping Rd
- 530 Roxbury Rd
- 667 Hopping Rd
- 680 Hopping Rd
- 534 Roxbury Rd
- 526 Roxbury Rd
- 7 Trotter Terrace
- 663 Hopping Rd
- 687 Hopping Rd
- 664 Brookside Dr
- 662 Brookside Dr
- 659 Hopping Rd
- 5 Trotter Terrace
- 684 Hopping Rd
- 522 Roxbury Rd
- 538 Roxbury Rd
- 689 Hopping Rd